
As a stock market trader , one cannot miss to understand the concept of “Support and Resistance” which is widely used in stock markets . When you start reading charts , one can clearly see how support and resistance is formed and respected . Various trading strategies are also developed by traders to take trades either on breakout or fake breakouts from Support and Resistance.
Concept
One of the important thing to evaluate in chart on any timeframe is :
- If the stock is going down then where it can STOP or PAUSE and MOVE UP ( This is called support zone )
- If the stock is going up then where it can STOP or PAUSE and MOVE DOWN ( This is called resistance zone )
Support Zone:
Lets see why “Support Zones” are formed which means a zone where buyers are getting active and buying happens again and again.
When stock prices are moving down from last few days , there will be a level or zone ( Say S1 ) where prices will halt for sometime and then starts moving up ( Means it changes its direction ) . Now all traders who have entered at that zone ( S1 ) will be happy and in some profits because prices are moving upwards from that zone.
Suppose after some time , stock again comes down to the same zone ( S1 ) ,so what will happen now :
a) There will be some traders who have not entered previously and now when prices have come to the same zone , they will enter at that price assuming that stock prices will go up again. They dont want to miss the profits now
b) The traders who have entered previously and booked some profits will enter again because their previous trade was profitable . Traders who have not booked profits might buy more stocks assuming that stock will move again up from that zone and they will be in more profit ( They have increased their quantity ) once prices start moving up.
When buying happens again and again at same level , a zone will be formed which is called as support zone . The chances of prices halting at that zone and again moving up is high.
Lets see a support zone in IEX in daily timeframe which was formed in September 2019 and respected in March 2020.
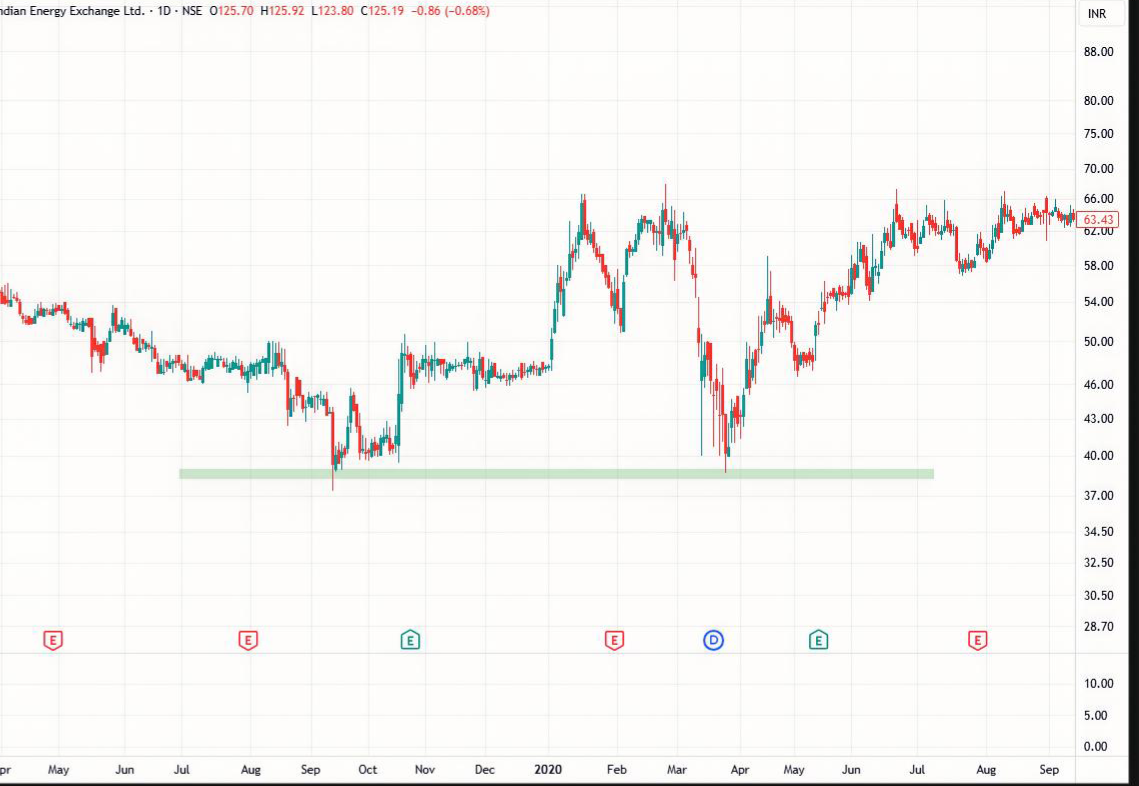
Fig 1 : This is chart of IEX on daily timeframe . A support zone was formed in September 2020 and when prices again came to the same zone , it reacted and acted as a support one again moving the prices higher.
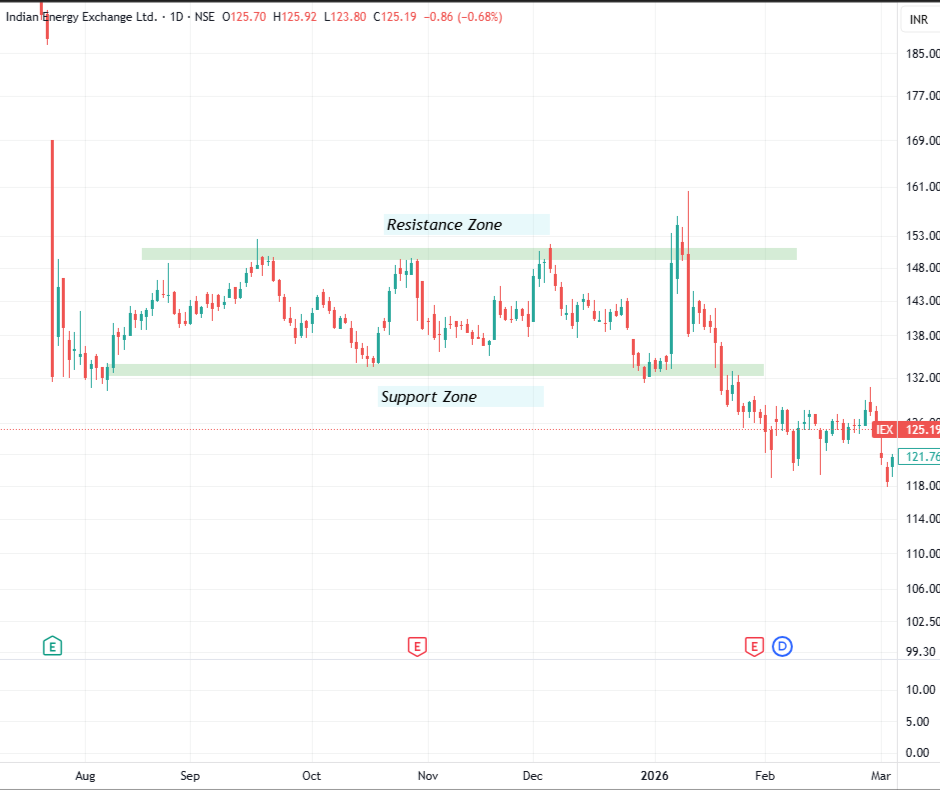
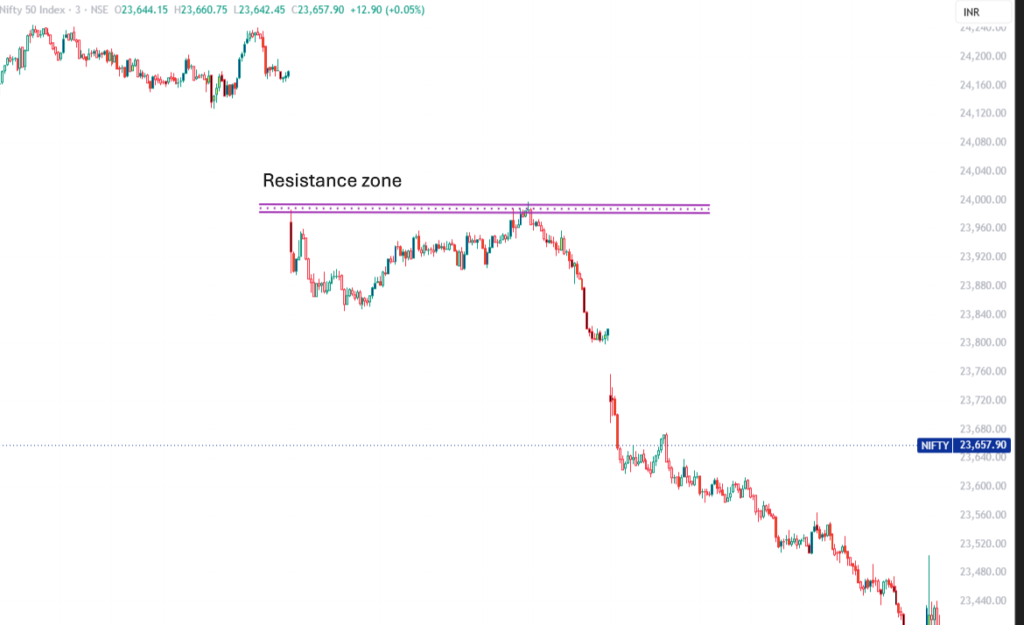
Resistance Zone:
Lets see why “Resistance Zones” are formed which means a zone where sellers are getting active and selling happens again and again.
When stock prices are moving up for some days , there will be a level or zone ( Say R1 ) where prices will halt for sometime and then starts moving down. Now all traders who have entered at that zone thinking that prices will go up from R1 will be in some loss (As prices have moved down instead of moving up)
Suppose after some time , stock again comes up to the same zone ( R1 ) ,so what will happen now :
a) There will be some traders who have not booked the profit previously and now when prices have come to the same zone , they will sell at that price assuming that stock prices will go down again from that level(These are traders who have entered the stock before it has reached R1)
b) The traders who have entered previously at R1 will sell their holdings fearing that prices will move down again . They might take some loss but are not willing to take larger loss or hold for more period of time.( When you buy a stock and it starts moving down , we only pray that stock prices come to the same prices again and we will exit the stock )
When selling happens again and again at same level , a zone will be formed which is called as resistance zone . The chances of prices halting at that zone and again moving down is high.
Major Support and Major Resistance
Major Support or Demand Zone
Its a zone from where prices took a sharp turn and moved up very fast . This zone is important because when prices will again come to the same demand zone , you can expect prices to go up again.
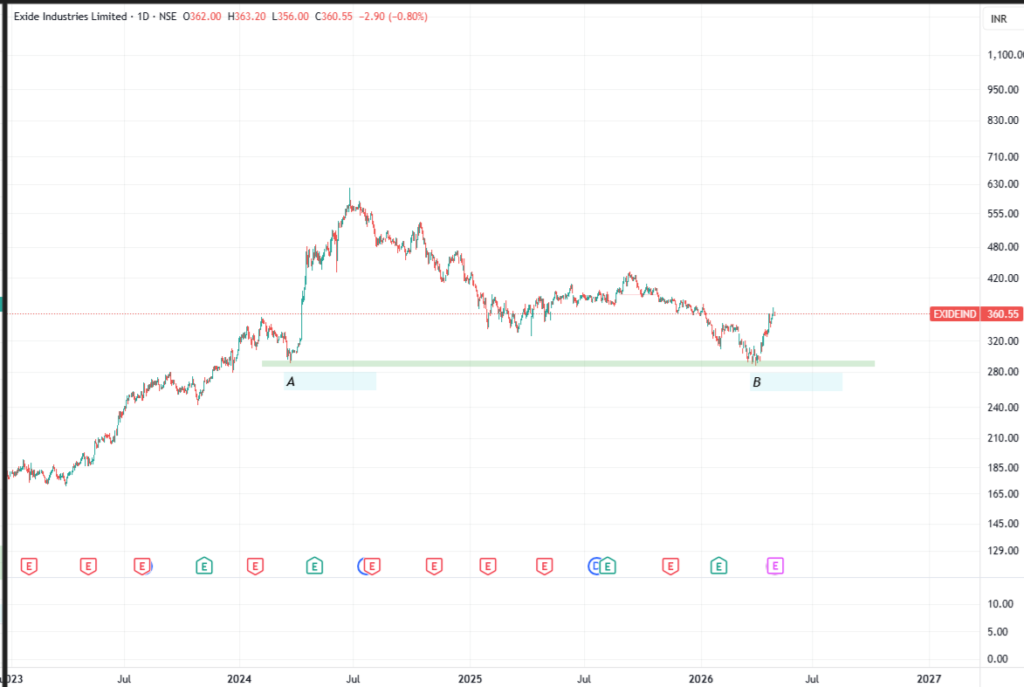
Major Resistance or Supply Zone
Its a zone from where prices took a sharp turn and moved down very fast . This zone is important because when prices will again come to the same supply zone , you can expect prices to go down again.
Any opinions, news, research, analyses, prices, or other information contained on this website is provided as general market commentary for educational purpose only and does not constitute investment advice. StocksGully will not accept liability for any loss or damage including, without limitation, to any loss of profit which may arise directly or indirectly from use of or reliance on such information.