
One of the common beliefs in stock market is that prices fall 2 to 3 times faster than they rise. So, in this article we will discuss Bearish Marubozu candle which indicates a strong selling pressure and helps you make money when there is a fear of loss among traders. Like we discussed in Bullish Marubozu candle , we will cover :
- What is Bearish Marubozu candle?
- How to spot this candle on chart and what it means?
- How to take high probability trades using Bearish Marubozu candle?
No of candlestick pattern: Single candlestick pattern
Reversal or continuation pattern: You can spot in both the scenarios (Reversal or continuation). Depends on chart pattern
How to spot a Bearish Marubozu candle?
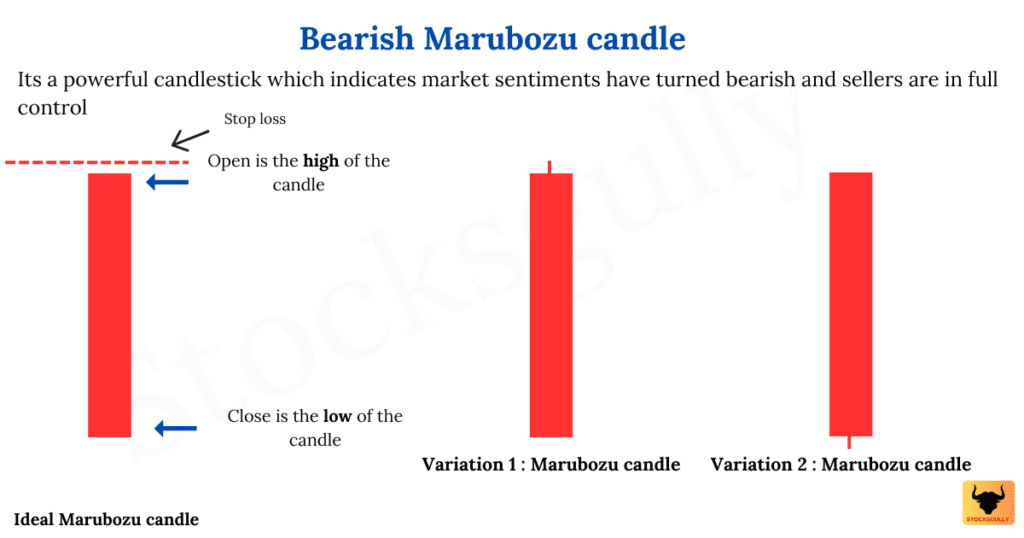
Bearish Marubozu candle have a very large red body with no or very little shadow/wick . Wick should not be more than 2-3% of the range (The difference between high and low of the candle) of the candle. It’s not a rule but you will get to know more as you study charts. Some question which can come to your mind
- What does a large candle mean here?
- How will I know whether the candle formed is large or normal?
While there is no specific range defined for large like it should be 50 points or 100 points, but when you start analyzing candlestick charts, any candle which looks bigger as compared to previous few candles and has no wicks can be classified as a Marubozu candle.
Why there should be no or very small wick in Bearish Marubozu candle? This candlestick pattern indicates that sellers are in full control. If there is a big wick, it means buyers have tried to push the prices in the opposite direction and hence buyers are there which should not be the case when Bearish Marubozu candle is formed. This will also get clearer later in this article.
For this candle open price = high price and close price = low price.
Stop Loss : The high of the candlestick indicates that there are sellers at that level pushing the prices down. Now suppose the prices break this level with a green candle. This means that all sellers will cover their loss by buying their position which will move the prices further up. So, the high of this candle should be your stop loss.
Understanding the psychology behind the Bearish Marubozu candlestick?
A trader should pay great attention to this candlestick because it indicates that the market is now dominated by sellers, and that price movement is likely to keep going in the same direction.
If we go by the shape of a Bearish Marubozu candle, then from the moment price opens, the market keeps on pushing the prices down and as there is no upper or lower wick, it closes strongly at the low (Buyers were never able to dominate and hence there should be small or no wick) . This means that sellers are selling it at every price point.
Any candlestick shows fight between buyer and seller in the market and when Bearish Marubozu candle forms, it shows that sellers have completely dominated buyers.
What Does a Bearish Marubozu Candlestick Tell You
Whenever this candlestick appears on charts it indicates that market sentiments have turned bearish and there is a high probability that bears can come into the market to push the prices down.
How to Trade Bearish Marubozu candlestick
Now we know that the bearish Marubozu candlestick is powerful candle as it indicates bearish market sentiment but as always there are few things which you can consider:
1. The red candle length is very large
A logical stop loss for this candle is at the high of the candle, a large red candle will also make your stop loss larger. So it depends on the risk taking ability of the trader to trade the candle (Whether he/she is willing to take that risk)
2. How volume matters in Marubozu candle
Uptrend
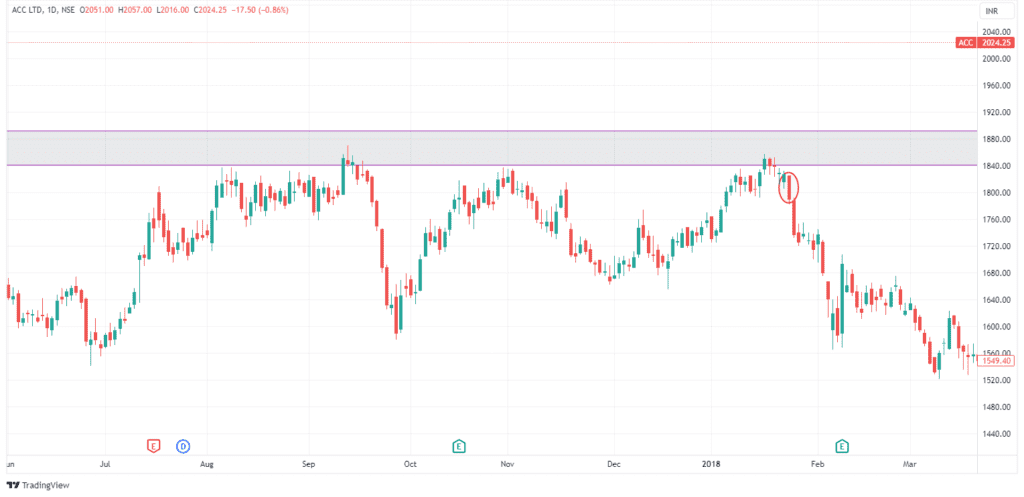
If there is an uptrend and Bearish Marubozu candlestick is formed with a high volume , then it signals a chances of reversal from that level as bears have entered the market.
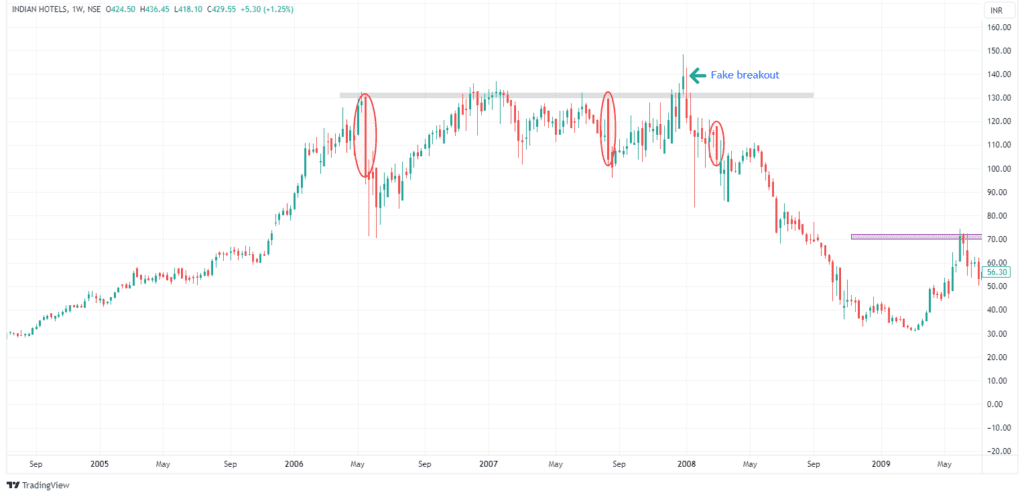
Range breakout
If prices are in range and Bearish Marubozu candle is formed with high volume chances are high that prices will move down
Downtrend
Suppose there is downtrend going on and you are seeing back to back red candles with no retracement . If Bearish Marubozu candle is formed in such scenarios , you should wait for retracement rather than taking a short position because market might see consolidation or reversal from the Marubozu candle
Breakout
This candlestick is is great for breakout traders. A breakout with Bearish Marubozu candlestick can give a good return in small time to swing traders.
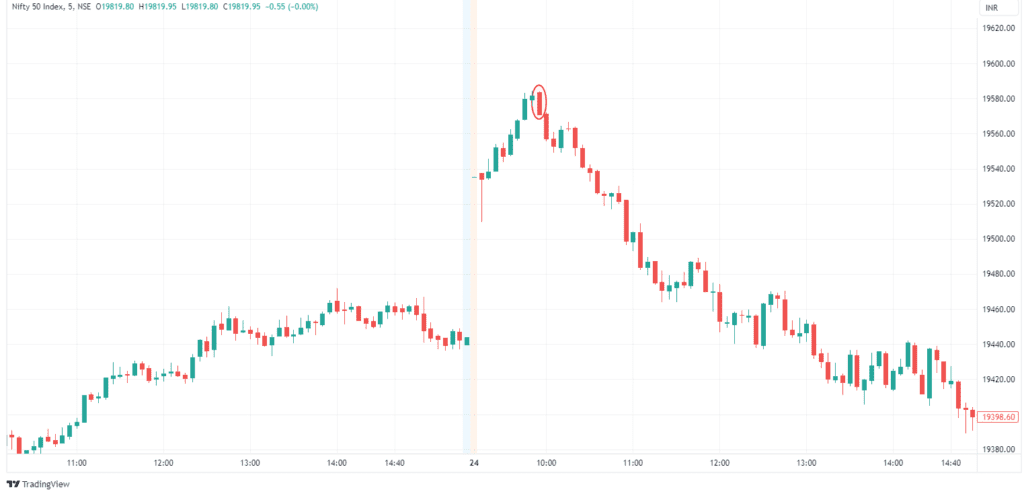
Intraday Traders
Condition:
- There should be a strong upward price movement ( 5 min time frame )
- If bearish Marubozu is formed after upward price movement, then there is high probability of a downmove
- The high of Marubozu candle should be a strong resistance or supply zone.
Note : To illustrate the concept , we take examples where the candles have worked but when you analyze the chart , you will also find places where these candles or setup has not worked . This doesn’t mean that concept is wrong but you need to practice more charts and backtest . No candle or setup works 100% in stock market but we need to understand the concept first and practice on charts. Try to create your own trading style
Key takeaways
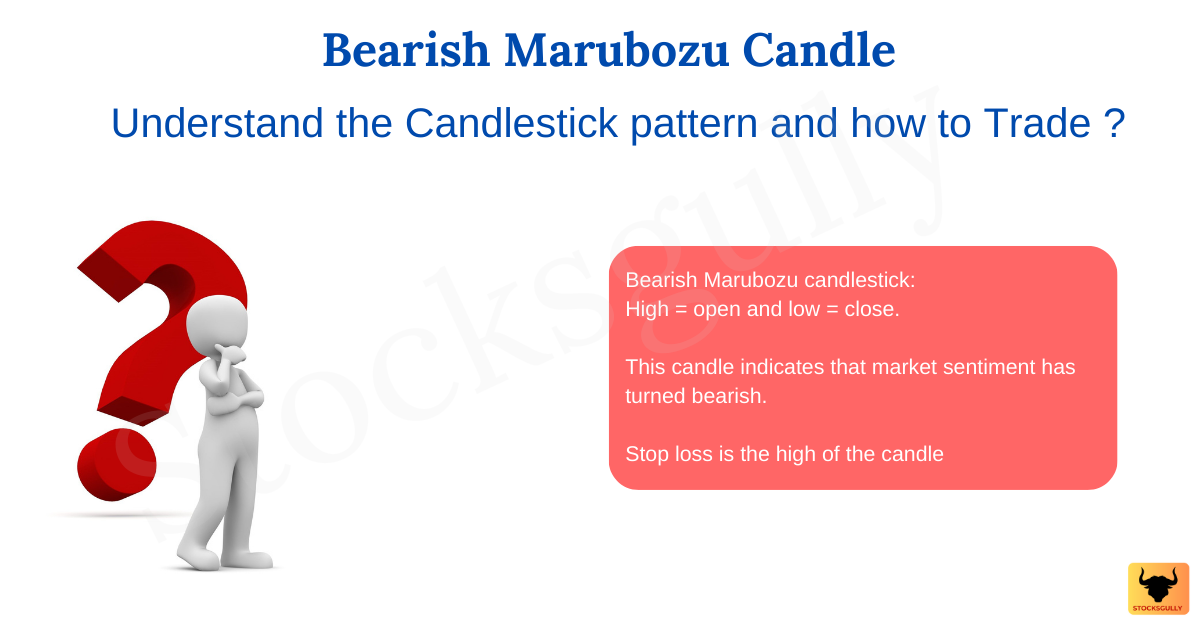
- Bearish Marubozu candlestick is a single candlestick pattern where high = open and low = close.
- This candle indicates that market sentiment has turned bearish and bears can enter the market after this candle is formed to push the prices down
- Stop loss is the high of the candle as sellers are there at that level
Recommended articles on Trading and Investing
Any opinions, news, research, analyses, prices, or other information contained on this website is provided as general market commentary for educational purpose only and does not constitute investment advice. StocksGully will not accept liability for any loss or damage including, without limitation, to any loss of profit which may arise directly or indirectly from use of or reliance on such information