

In this “Swing trading strategy: No 6”, we will discuss “Weekly Inside Bar Strategy”. This we can apply when we expect prices to go up or down but as we are discussing swing strategy in equity(cash) , we will discuss the rules when prices are expected to go up.
Swing trading strategies on higher timeframe can give a very good risk reward ratio as stop loss will be lower and a trader can trail for higher profits.
Concept
In this strategy we will use Inside Bar Candlestick pattern on which we have seen various strategies earlier like VWAP Inside Bar strategy.
The important points to trade this pattern are :
1. Inside candle signifies that range of trading is narrowed or consolidation is happening and there is a probability that range will now expand going forward.
2. Range expansion results in a breakout and trade is taken in the direction of breakout. Breakout means when any candle after inside candle pattern breaks the high or low of inside bar.
We will search for this pattern in weekly timeframe and in this strategy we will look for 1 mother candle and 2 inside candle.
Weekly Inside Bar | Swing Trading Strategy
Selection of Stocks
- Choose Stocks with enough liquidity.
- It can be Large cap, Mid cap, or Small cap stock.
- Filter or keep in your watchlist those stocks where you see three inside candles on a weekly timeframe.
Entry Rule
Step 1: Filer stocks where there is one mother candle and 2 inside candle on a weekly timeframe.
Step 2: Mark the range of the mother candle and wait for upside breakout .
Step 3: Enter once you see a DAILY candle closing above the range of mother candle .
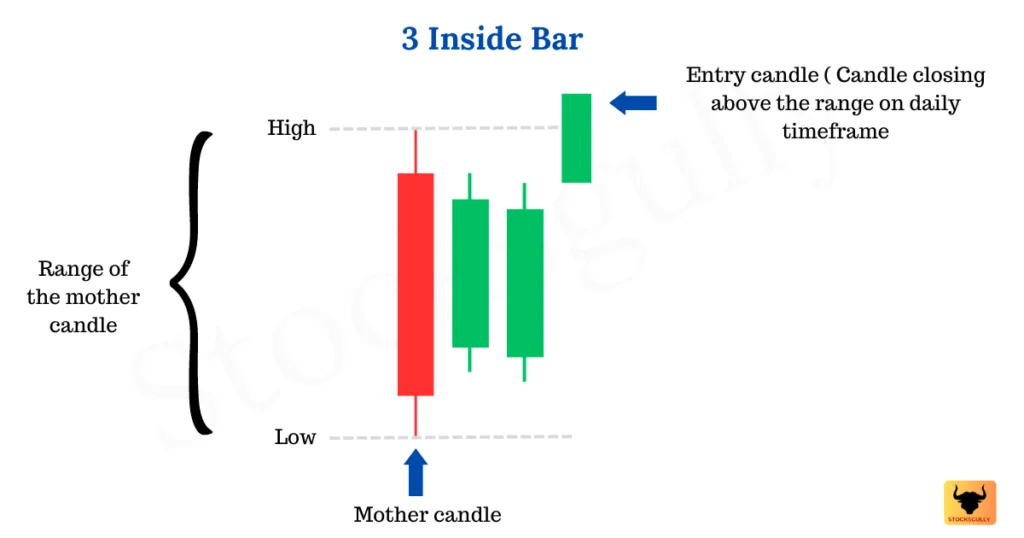
Note : Here we are using daily candle for entry to get the higher risk reward ratio . Once the 3 week range is broken upside by daily candle , we can assume that trend will continue higher from this level.
Stop Loss
Now let us understand where we will put stop loss in this strategy
Stop loss in this strategy can be kept at lower range of mother candle . We will exit the trade once a DAILY CANDLE closes below the lower range of mother candle.
Exit Rule
We will keep Risk reward of minimum 2 to 3 in this trade setup . This means if risk in this trade is 100 Rs , our target should be atleast 200 to 300 Rs. The risk in the trade is difference between entry point and the lower range of mother candle. There are also different ways to exit
a) Trail the stop loss with either 9 EMA or 20 EMA.
b) Exit some quantities when you get risk reward of 2 and continue trailing remaining quantities till you get risk reward of 3
c) You can also put stop loss at cost after getting risk reward of 1.
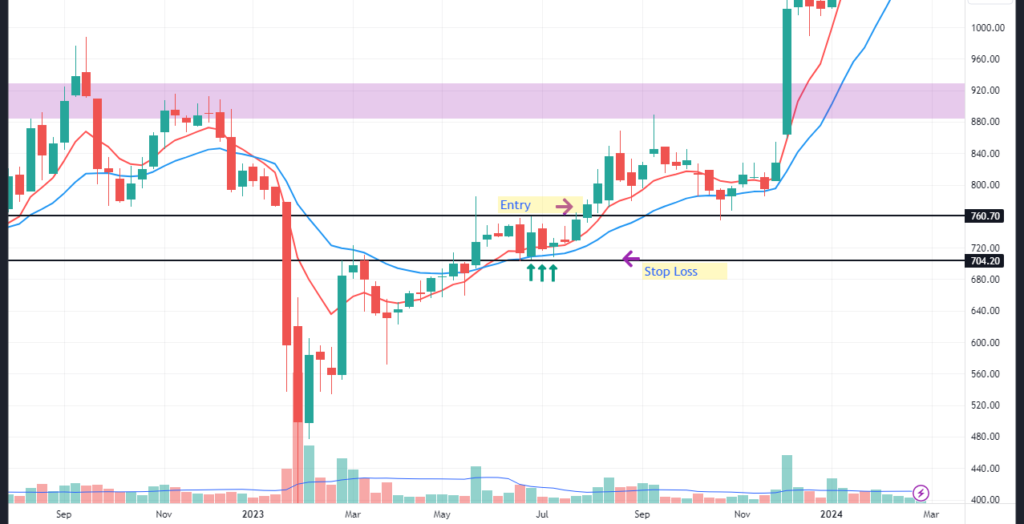
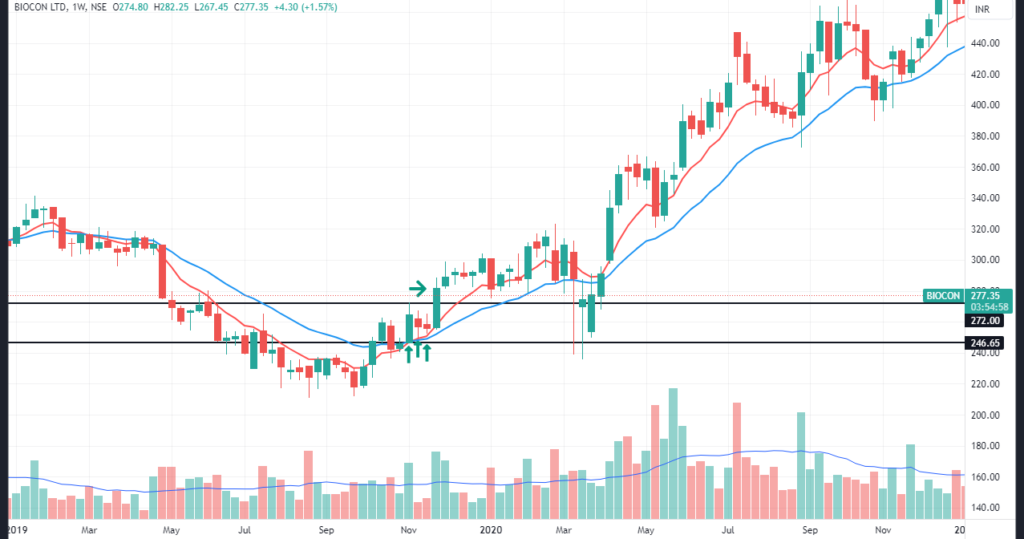
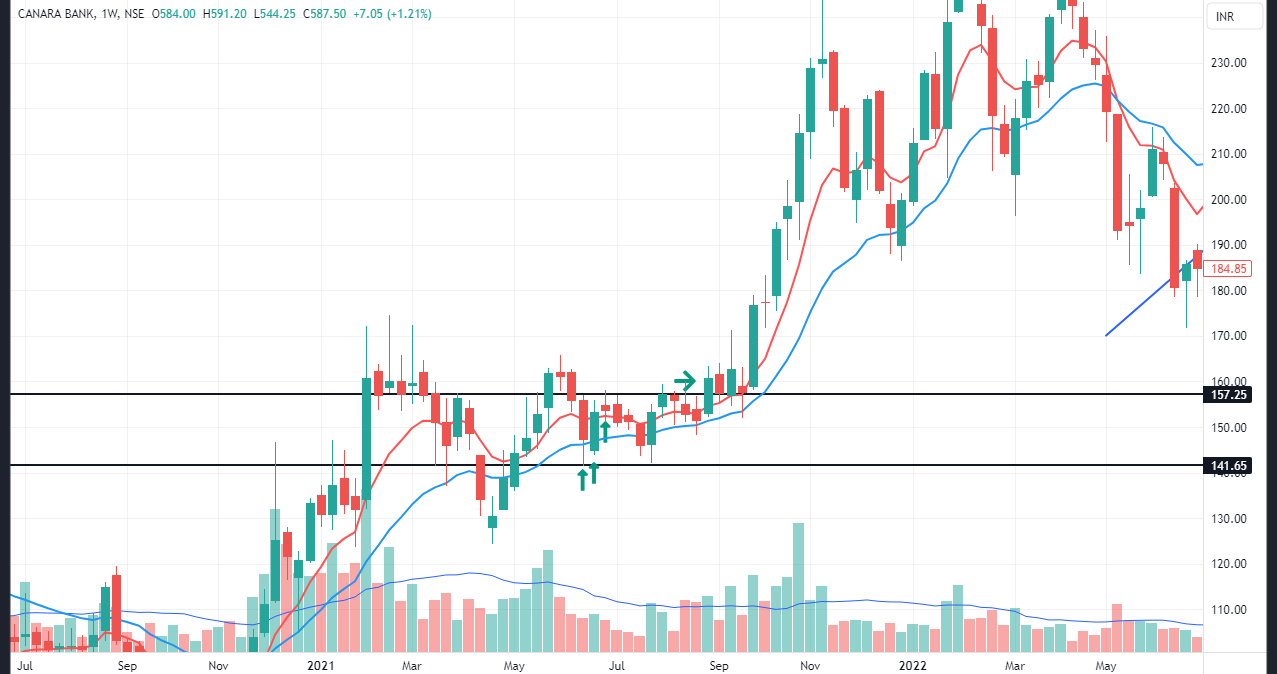
Lets see some Examples:
Important points to consider basis this setup
- Choose stocks which are in uptrend i.e. making higher highs and higher lows . You can also choose stocks which are above 100 or 200 Moving Average.
- More number of candles inside the range of mother candle is better once the range is broken upside . You can expect higher targets because consolidation was larger .
Any opinions, news, research, analyses, prices, or other information contained on this website is provided as general market commentary for educational purpose only and does not constitute investment advice. StocksGully will not accept liability for any loss or damage including, without limitation, to any loss of profit which may arise directly or indirectly from use of or reliance on such information.