

In this “Swing trading strategy: No 8”, we will discuss “ATH Breakout Strategy“. This we can apply when we expect prices to go up or down but as we are discussing swing strategy in equity(cash) , we will discuss the rules when prices are expected to go up.
This strategy is easy to apply and because we will trade only in momentum stocks , so it can give good returns in smaller duration .
Concept
In this strategy we will use multiple timeframe for analysis and taking entry and exit . Lets understand the ATH concept first and why it works :
- Stocks which are trading near all time high have good probability to continue momentum because buyers are showing interest in the stock
- As stocks prices have come again to all time high after retracement or correction , chances are that company fundamentals have improved
- As a trader , we want to take entry in stocks which have momentum and we expect it to continue.
- A higher timeframe breakout has lesser chances of a false breakout as compared to lower timeframes.
ATH breakout swing trading strategy
Selection of Stocks
- Choose Stocks with enough liquidity.
- It can be Large cap, Mid cap, or Small cap stock.
- Filter stocks which are trading near all time high in weekly timeframe . You can get lot of scanners online which can give you a filtered list of stocks .
Entry Rule
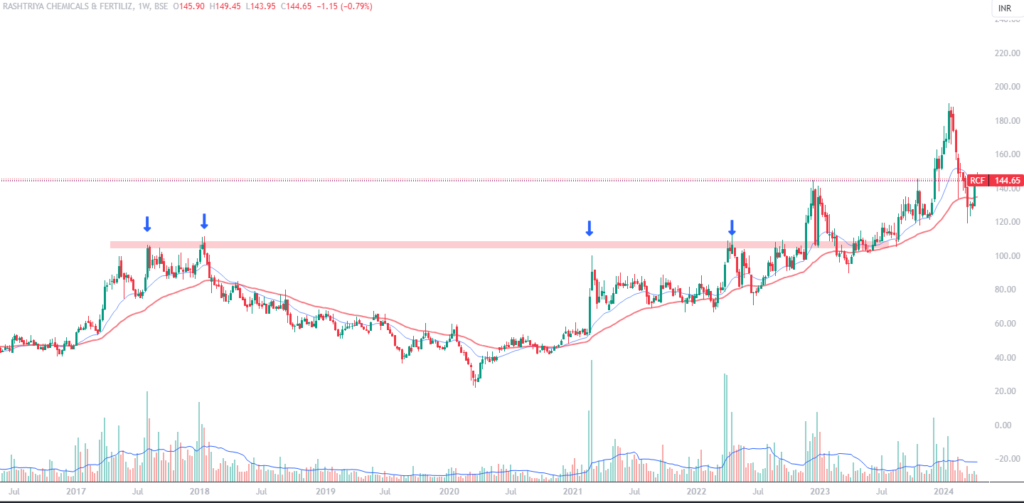
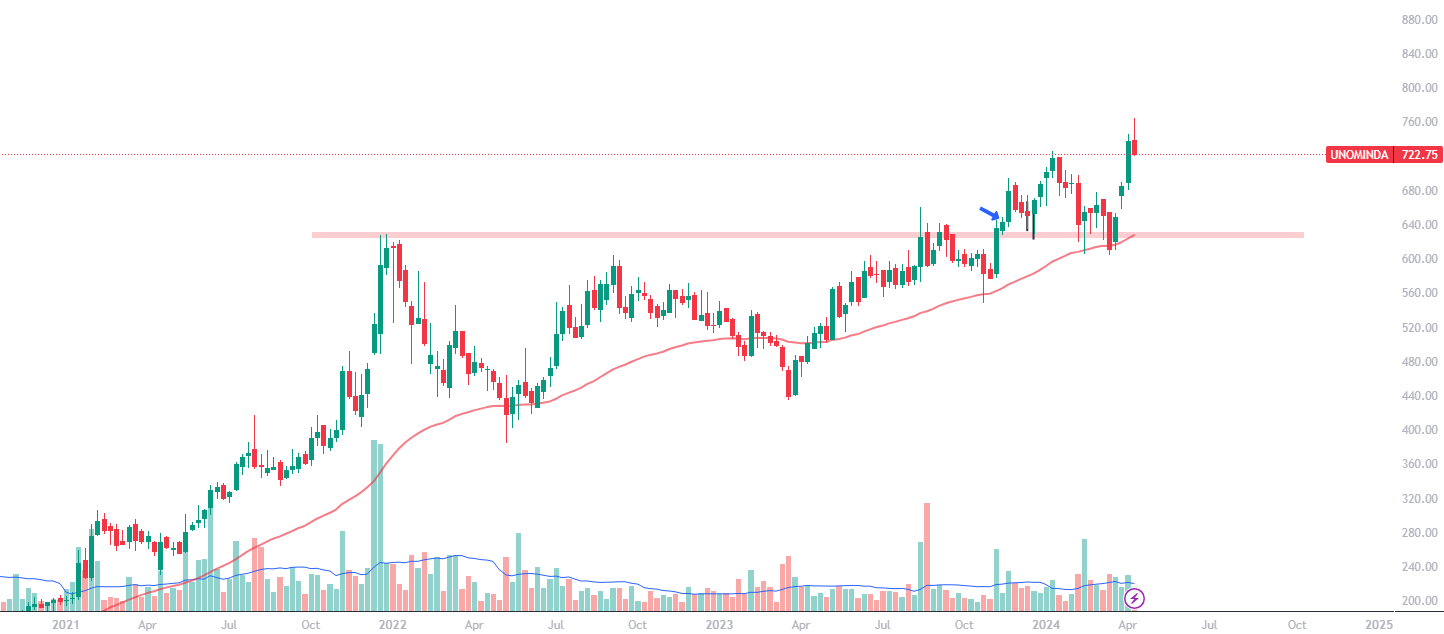
Step 1: Mark a line at All Time High prices of the stock which act as a resistance zone .We will wait for ATH breakout when prices close above this resistance zone in weekly timeframe ( Weekly candle should close above the resistance zone )
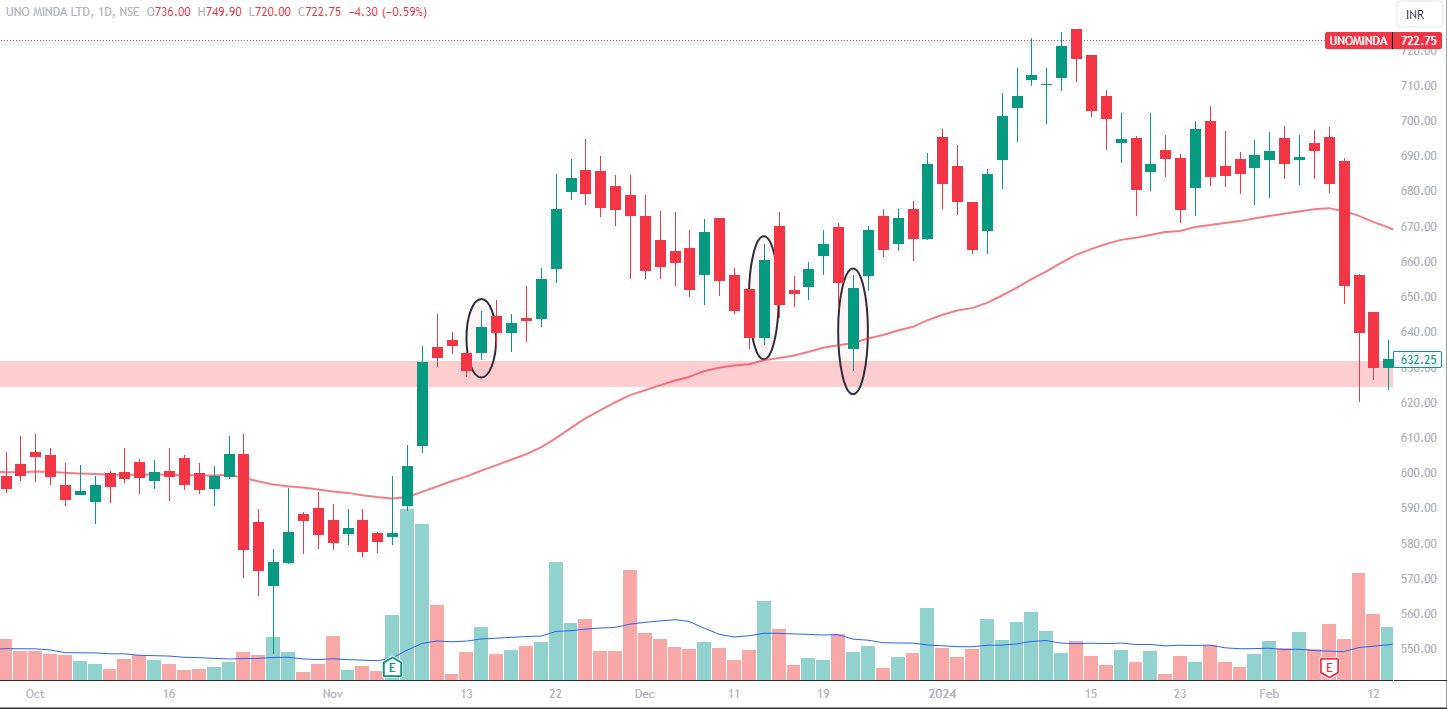
Step 2: Once we get breakout in weekly timeframe , then we will switch to daily timeframe for taking entry. ( A trader can choose to work only in weekly timeframe to take entry and exit too )
Step 3: Wait for price to retrace near previous resistance zone ( which we have marked in Step 1 ). This zone should act as a support zone now after the breakout . ( There will be times when prices will NOT retrace after breakout and continue momentum . It depends on the risk that a trader can take to enter just after breakout )
Step 4: Once we see a bullish candle or bullish pattern near this zone then we can enter into the trade.
Stop Loss
There are different ways to put stop loss in this strategy
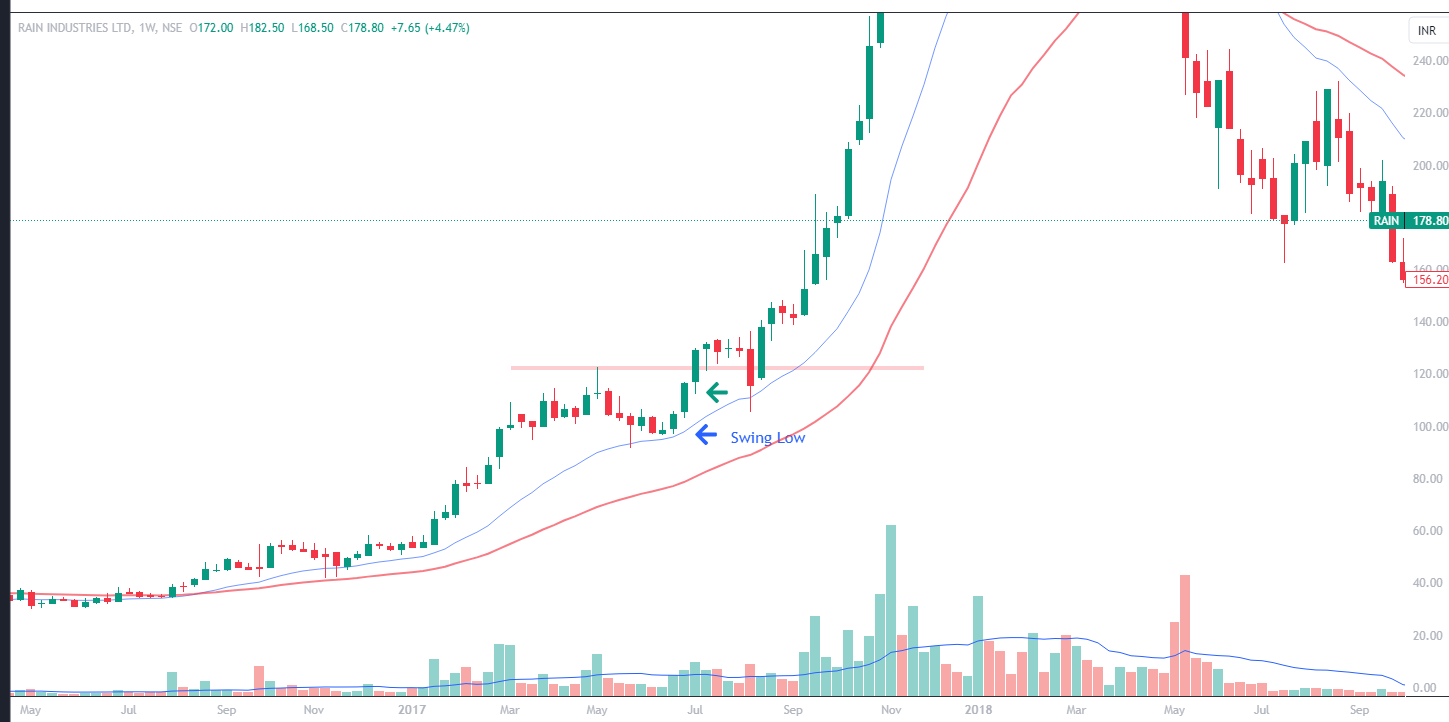
- You can put stop loss at swing low either in weekly or daily timeframe . (In weekly timeframe stop loss can be large and hence your target should also be large for maintaining a healthy risk reward ratio)
- The stop loss can also be put at low of the weekly breakout candle
Exit Rule
We will keep Risk reward of minimum 2 to 3 in this trade setup . This means if risk in this trade is 100 Rs , our target should be atleast 200 to 300 Rs. The risk in the trade is difference between entry point and your stop loss. There are also different ways to exit
a) Trail the stop loss with either 9 EMA or 20 EMA.
b) Exit some quantities when you get risk reward of 2 and continue trailing remaining quantities till you get risk reward of 3
c) You can also put stop loss at cost after getting risk reward of 1.
Lets see some examples now
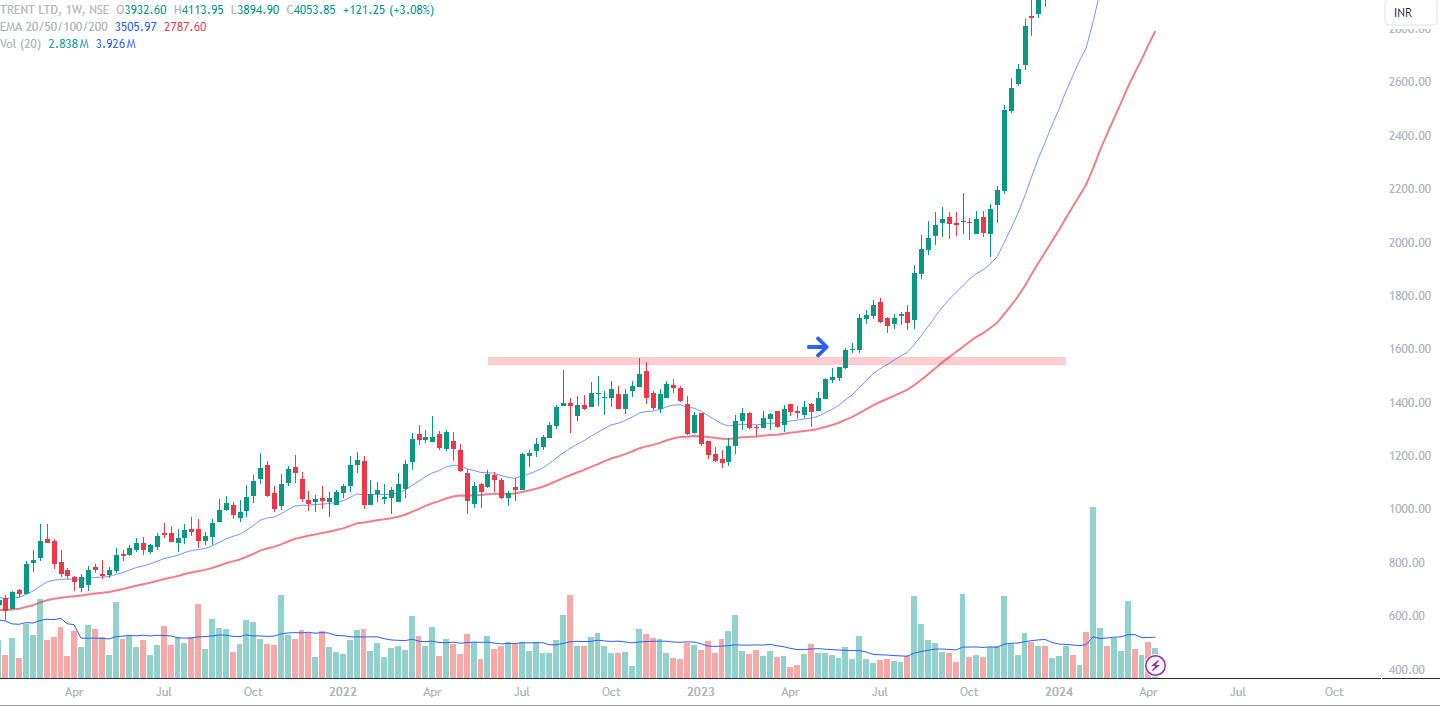
Example 1: Breakout on weekly timeframe and entry in daily timeframe
Example 2 : Entry and exit on weekly timeframe
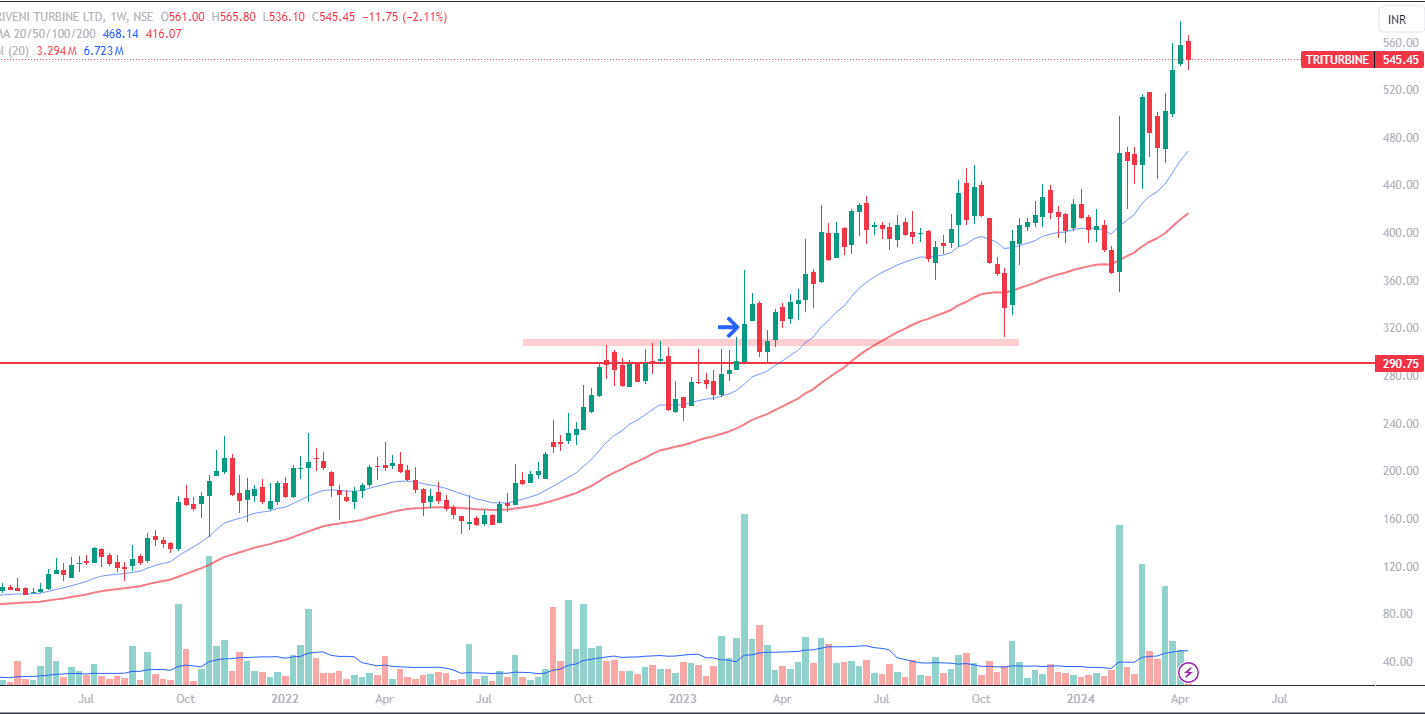
Example 3: Price not retracing back but continuing momentum
Important points to consider basis this setup
- Right Position sizing is important in this setup because risk will be different in every trade . The risk depends on the size of breakout candle and your stop loss as discussed above .
- You will NOT get much trades in this setup but risk reward will be great .
- Try to trail profits after getting risk reward of 2+
Any opinions, news, research, analyses, prices, or other information contained on this website is provided as general market commentary for educational purpose only and does not constitute investment advice. StocksGully will not accept liability for any loss or damage including, without limitation, to any loss of profit which may arise directly or indirectly from use of or reliance on such information.