In this “Swing trading strategy: No 5”, we will discuss RSI Grandfather-Father-Son(GFS) Strategy. This we can apply when we expect prices to go up or down but as we are discussing swing strategy in equity(cash) , we will discuss the rules when prices are expected to go up.
We will be using RSI indicator in this strategy , so first lets see a brief about RSI indicator.
What is RSI Indicator?
1.RSI is an oscillator ( Which means value will oscillate between 0 and 100 ) which measure the momentum in stock prices.
2.There are two levels which are important which is 70 and 30 . If RSI is below 30 then it is said that prices are in oversold zone and if prices are above 70 then it is in overbought zone . Once prices are in oversold and over bought zone then price reversal/halt is expected . While this is as per theory but in this strategy we will implement it differently so go through entire rules thoroughly:)
3. As per theory whenever prices goes above 50 then it means the momentum in upside is more and stock prices are rising with more magnitude then falling . ( When higher highs and higher lows are formed then prices are in uptrend with small retracements) . But as we will implement it differently so here we will divide the oscillator in three zones .
0-40 : Market is bearish (Usually market doesnt go below 20 . You can check on charts as well)
40-60 : Market is sideways
60+ : Market is bullish (Usually market doesnt go above 80-90 . You can check on charts)
Now lets see how you will use these zones :
a) Market is oscillating between 40 and 80 : It means that there is an “uptrend” and whenever there is a retracement ( When RSI comes around 40 level ) , bulls again enter the market and push prices upwards ( RSI takes a turn from 40 and moves upwards )
b) Market is oscillating between 60 and 80 : It means that there is a “strong uptrend” and whenever there is a retracement ( When RSI comes around 60 level ) , bulls again enter the market and push prices upwards ( RSI takes a turn from 60 and moves upwards ) . This is not an uptrend but a strong uptrend because bulls are not even allowing prices to come around RSI of 40.)
c) Market is oscillating between 20 and 60 : It means that there is a “downtrend” and whenever there is a retracement ( When RSI comes around 60 level ) , bears again enter the market and push prices downwards ( RSI takes a turn from 60 and moves downwards)
d) Market is oscillating between 20 and 40 : It means that there is a “strong downtrend” and whenever there is a retracement ( When RSI comes around 40 level ) , bears again enter the market and push prices downwards ( RSI takes a turn from 40 and moves downwards)
e) If market is between 40 and 60 : It means that market is sideways so once it goes to 60 , bears pull it down and once it reaches 40 bulls pull it up.

So in a nutshell if the stock is in strong uptrend it should not go below 60 RSI level and if stock is in strong downtrend it should not go above 40 level.
Concept
1. We will use multi timeframes for confirming the bullish trend in prices . We know that as we go higher in timeframe , there are lesser fake signals .
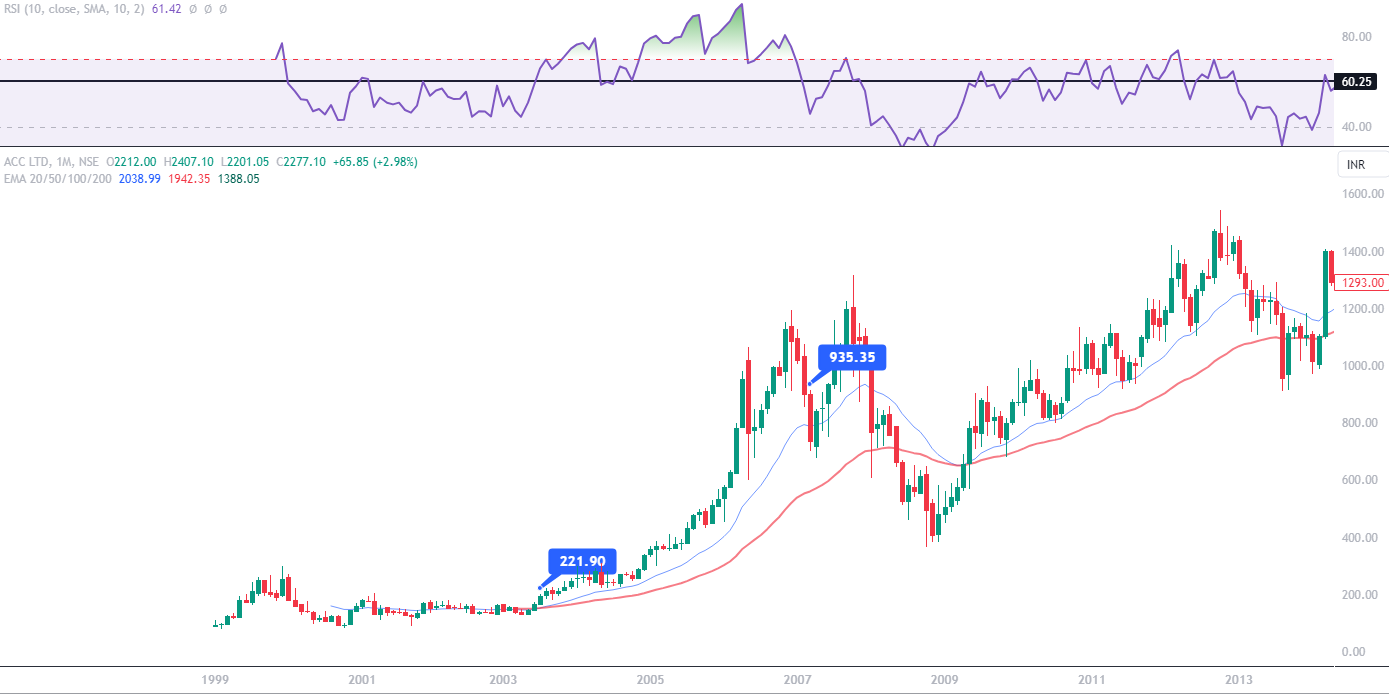
2. We will use Monthly , Weekly and Daily timeframe in this strategy . If prices are bullish in monthly and weekly timeframe , then we can assume that long term trend in stock prices is upward. Once there is retracement in daily prices , we will look for buying opportunities because in larger timeframe stock prices are showing strength.
a) Grandfather ( Monthly trend ) – Bullish
b) Father ( Weekly trend ) – Bullish
c) Son ( Daily trend ) – Should show some Bullish candlestick pattern or should be at support zone after retracement.
RSI GFS | Swing Trading Strategy
Selection of Stocks
- Choose Stocks with enough liquidity.
- It can be Large cap, Mid cap, or Small cap stock.
Entry Rule
Step 1: Filter stocks where RSI is above 60 in monthly and weekly timeframe . This means long term trend should be upwards.
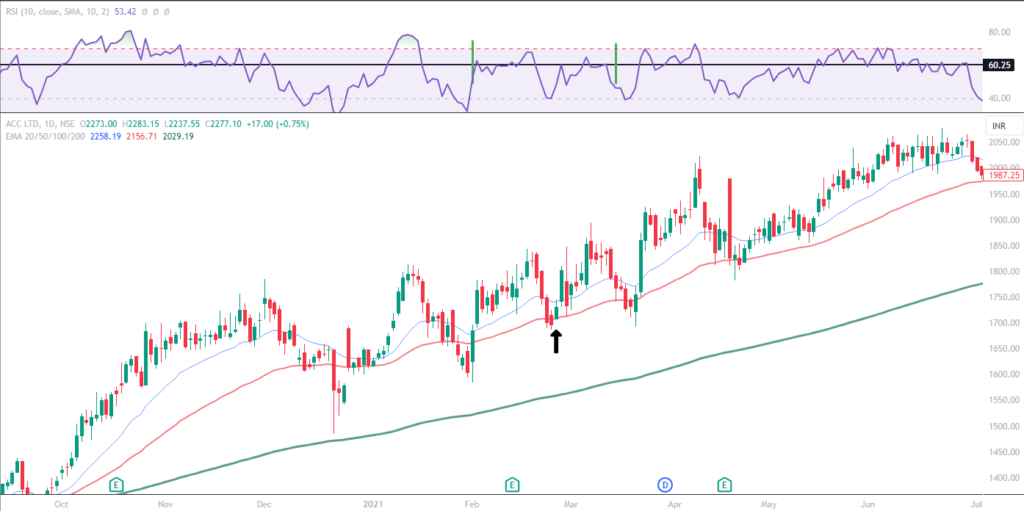
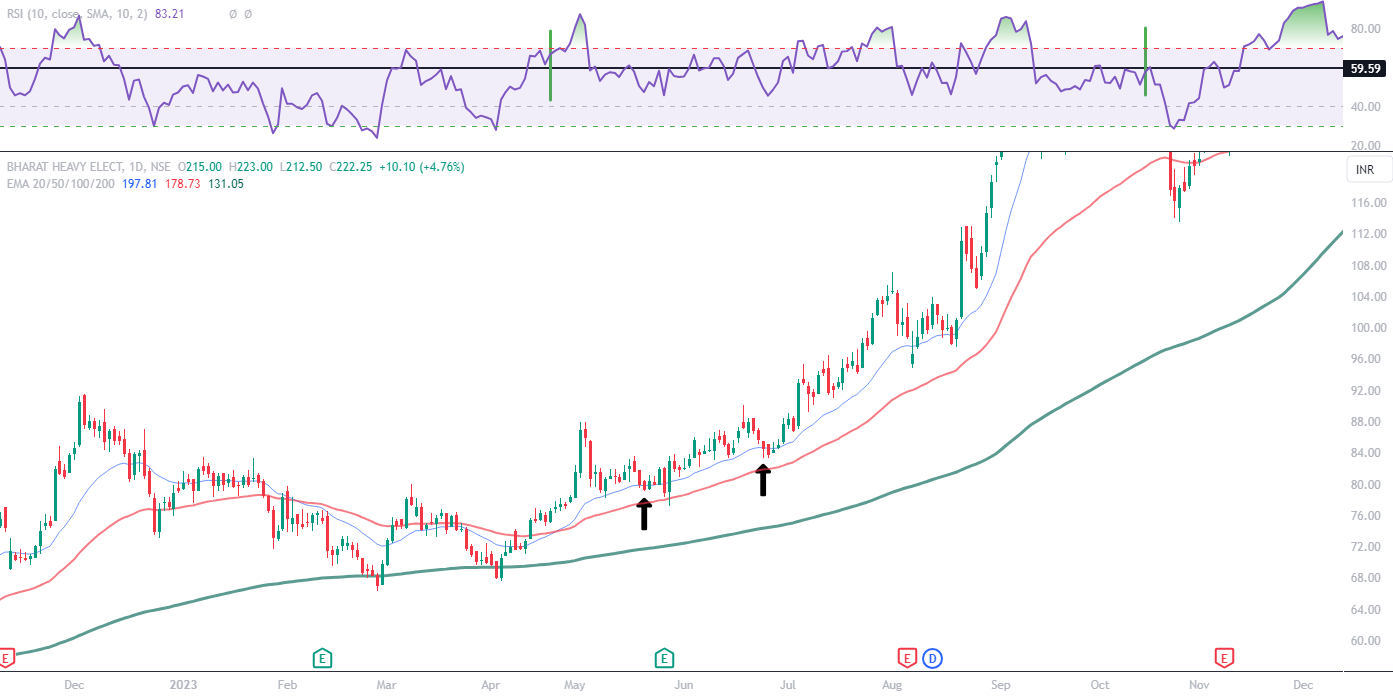
Step 2: Wait for RSI to come around 40 level to take the trade in daily timeframe.
Step 3: Enter once you see a bullish candlestick pattern/support zone or you can enter at green candle ( At around 40 level ) .
Note : Bullish candlestick pattern along with RSI indicator helps in entering good probability trade.


Stop Loss
Now let us understand where we will put stop loss in this strategy
Stop loss in this strategy can be kept at swing low or if RSI moves and sustain below 40 . It depends on the risk appetite of the trader and how much he/she is willing to risk in single trade. Once RSI moves below 40 , it means that our trade assumption of stock prices to bounce from this level is not valid and we might see sideways or downward move going forward.
Exit Rule
We will keep Risk reward of minimum 2 in this trade setup . This means if risk in this trade is 100 Rs , our target should be atleast 200 Rs. The risk in the trade is difference between entry point and swing low. There are also different ways to exit
a) Trail the stop loss with either 9 EMA or 20 EMA.
b) Exit once the RSI level is reached to 70 or above .
Stocksgully Tip for Backtesting
- On Monthly timeframe , mark the level on RSI chart when monthly RSI is above 60 with a vertical line
- Now move to weekly timeframe and check whether weekly RSI is above 60 or not and till which time period ( The line which you have marked in step 1 will be visible in weekly timeframe ). Mark with vertical line again till when the RSI is above 60.
- After completing Step 1 and Step 2 , switch to daily timeframe and you will get two vertical lines on RSI chart which shows the period where monthly and weekly RSI is above 60. Now check when RSI is coming at around 40 level on daily timeframe ( Between Green lines on RSI chart ) and whether prices are bouncing off or not from that level.
Important points to consider basis this setup
- We will focus on RSI indicator signals and bullish candlestick pattern to take high probability trade
- This setup involves lot of chart readings in different timeframes but offers a very good risk reward ratio.
- Follow stop loss with discipline to maintain risk reward ratio and achieve profitability.
Any opinions, news, research, analyses, prices, or other information contained on this website is provided as general market commentary for educational purpose only and does not constitute investment advice. StocksGully will not accept liability for any loss or damage including, without limitation, to any loss of profit which may arise directly or indirectly from use of or reliance on such information.

