
In this “Swing trading strategy: No 4”, we will discuss Pin Bar Candlestick Strategy. This we can apply when we expect prices to go up.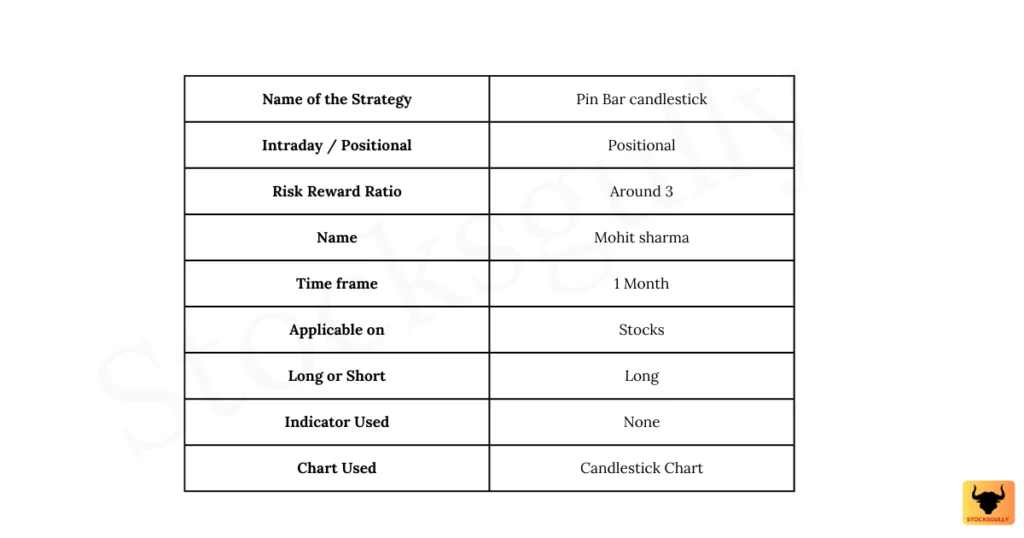
Concept
1. A candlestick give valuable information about the psychology and underlying price dynamics of the market . It helps you in understanding whether market sentiments are bullish or bearish by analyzing candlestick patterns. You should always pay attention to bullish and bearish candlesticks patterns formed at a significant support and resistance levels ( We will discuss support and resistance in detail later ). The analysis becomes very important and conviction can come while trading if you also analyze the current trend in a larger time frame.
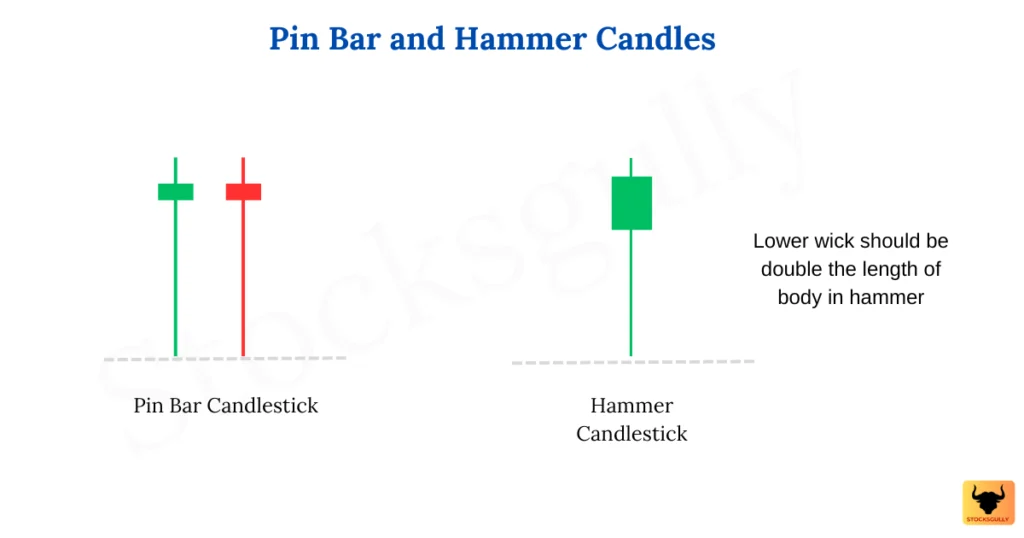
2. A Pin bar candlestick or hammer candlestick is a bullish candlestick pattern which indicates that reversal might happen in prices now on the upside.
3. If this candlestick is formed in a higher timeframe like monthly , then it can provide a very good risk reward to a trader with good accuracy ( Fake signals are lesser in higher timeframe )
Pin Bar Candlestick | Swing Trading Strategy
Selection of Stocks
- Choose Stocks with enough liquidity.
- It can be Large cap, Mid cap, or Small cap stock.
Entry Rule
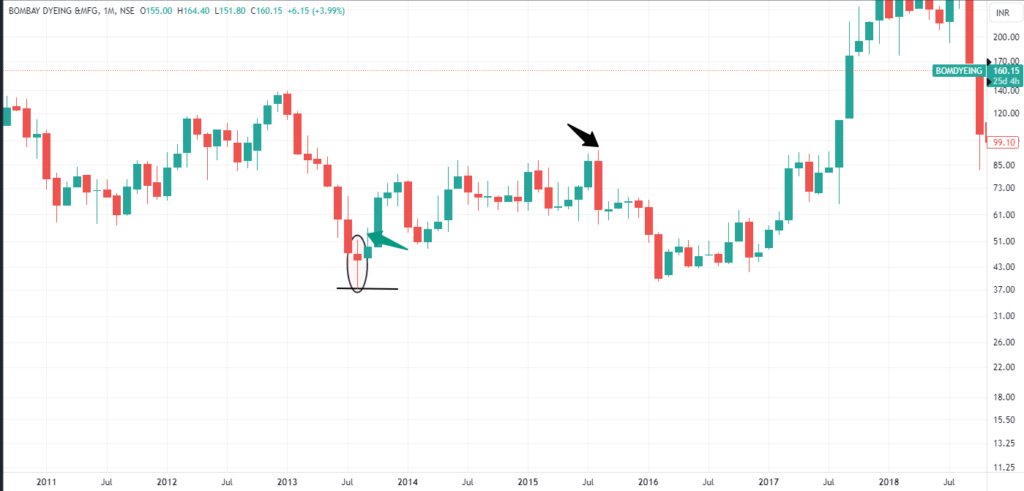
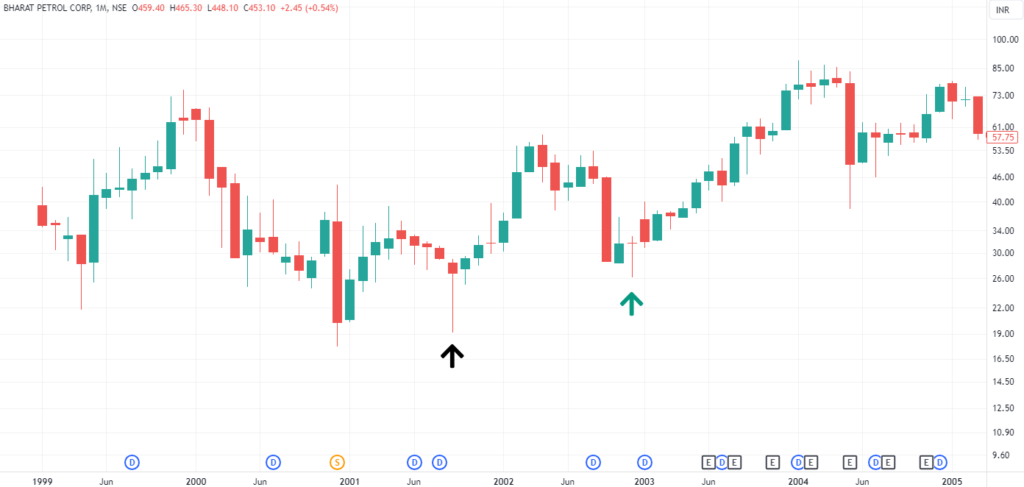
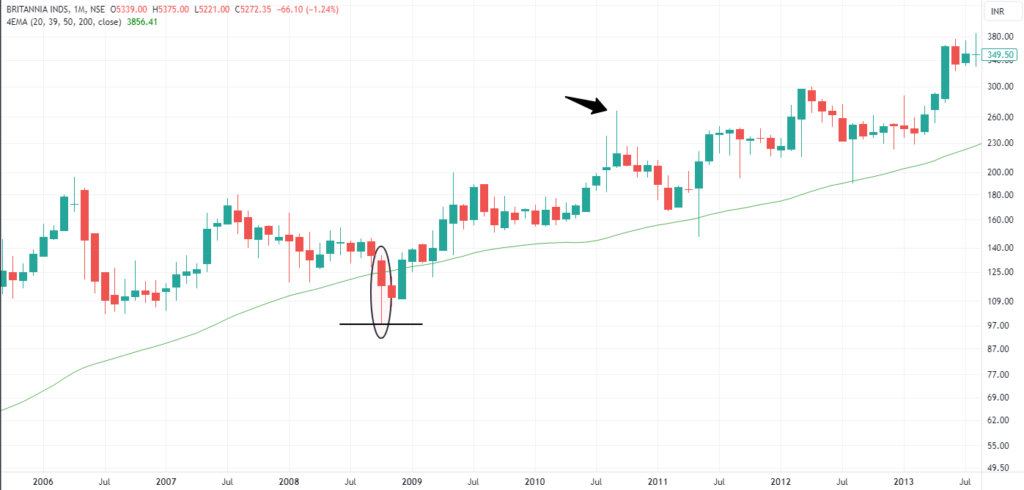
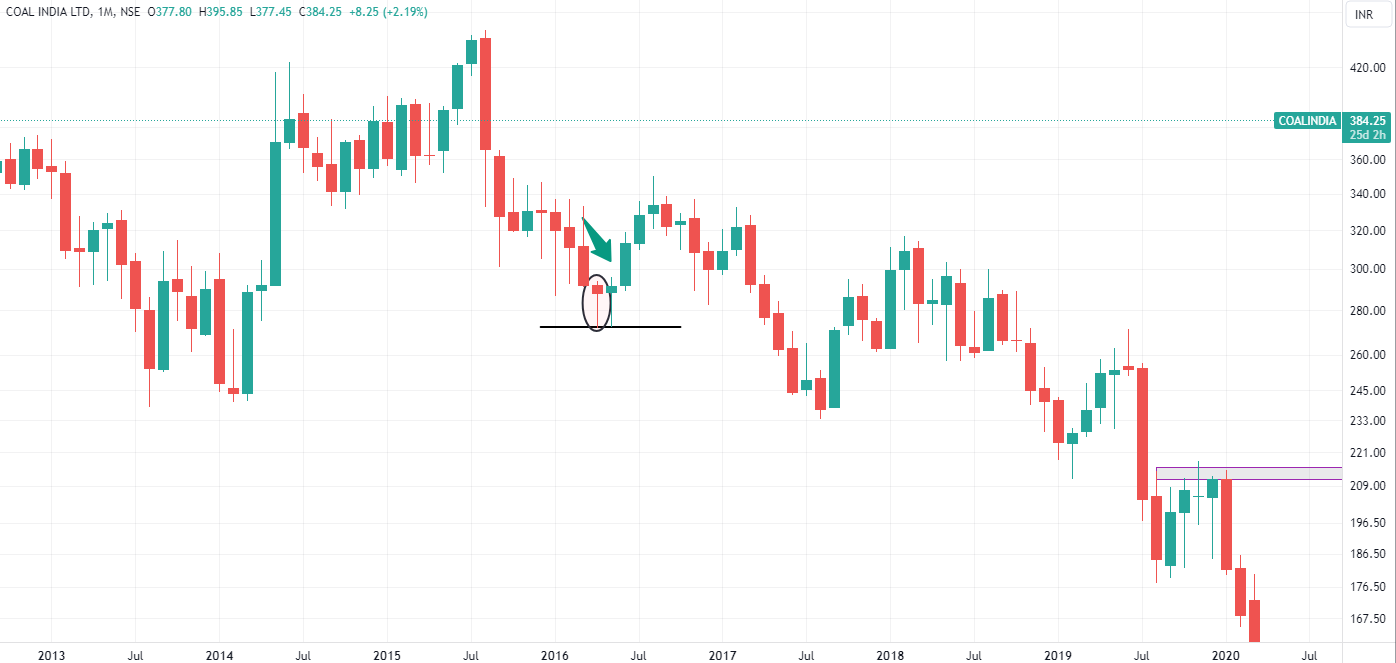
Step 1: Check for stocks where prices have sharply fallen down or its in a downtrend. All the analysis will be done in monthly timeframe
Step 2: Check if there is a Pin bar or Hammer candlestick formation after sharp downside move by the stock. This will become our alert candle
Step 3: The low of pin bar candle should be last 2 years low . If all conditions are met , we will enter the trade once high of the alert candle is broken. We will not wait for next candle close but will enter as soon next candle breaks high of the alert candle.
Note : We have used three things in the entry on this setup .
a) Pin Bar or hammer candlestick : A bullish candlestick pattern which indicates a potential reversal
b) Two years low : This means there is a potential support at the place ( We will check this on chart too )
c) Confirmation candle : We will enter once prices break the hammer or pin bar candle high and hence a confirmation that prices can now reverse.
Lets see some examples now
Stop Loss
Now let us understand where we will put stop loss in this strategy
The stop loss in this strategy can be kept just below alert candle low . If stop loss is hit , it means our market view is wrong and stock will move downwards and we will look for another opportunities . The low of pin bar or hammer candlestick act as a support
Exit Rule
We will keep risk reward of minimum 3 in this trade setup . This means if risk in this trade is 100 Rs , our target should be 300 Rs. The risk in the trade is difference between entry point and low of pin bar candle.
To minimize the potential loss , you can also move your stop loss at buying cost after achieving risk reward of 1 . This means if your buying cost is 100 Rs , then once stock reaches 200 Rs , you can place your stop loss at 100 Rs . The exit will be at 300 Rs keeping risk reward of 3.
Important points to consider basis this setup
- The entry and exit are purely on price action and you need one thing to trade this setup which is PATIENCE 🙂
- As this setup is on monthly timeframe so you will not get frequent entry and exit but it has a good risk reward ratio. It can be a good setup if you want to start your trading journey or it can be one of the setup’s if you want to keep stock for longer duration in your portfolio with a good percentage return.
- The stop loss can be large basis % of capital deployed but returns will also be higher.
- Always divide you capital into parts and then trade, otherwise a big part of you capital will be lost . If the trade is wrong and you have invested all capital in one trade , you will loose a good amount and confidence in taking the next trade might get affected.
Any opinions, news, research, analyses, prices, or other information contained on this website is provided as general market commentary for educational purpose only and does not constitute investment advice. StocksGully will not accept liability for any loss or damage including, without limitation, to any loss of profit which may arise directly or indirectly from use of or reliance on such information.