
In this “Swing trading strategy: No 3”, we will discuss Box Trading Strategy. This we can apply when we expect prices to go up.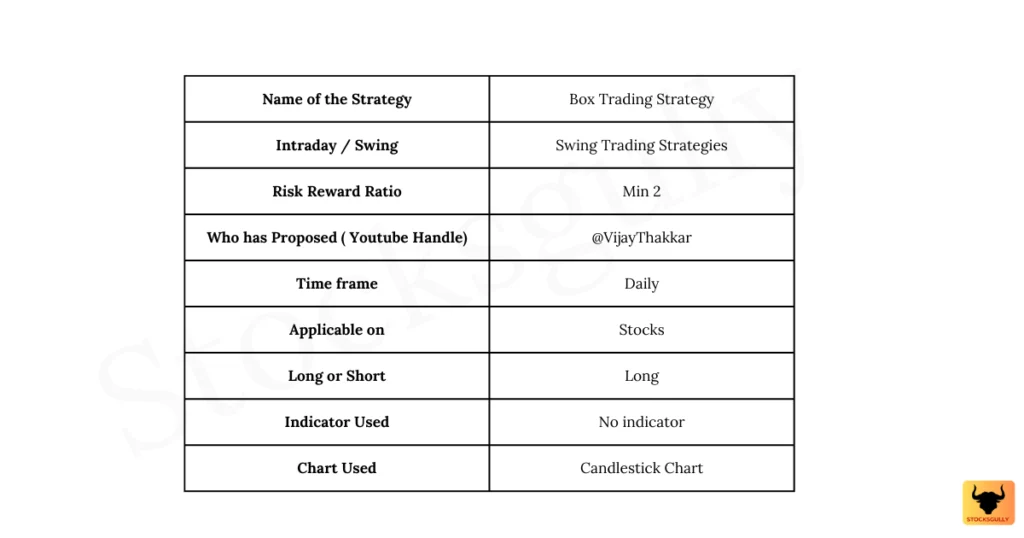
Concept
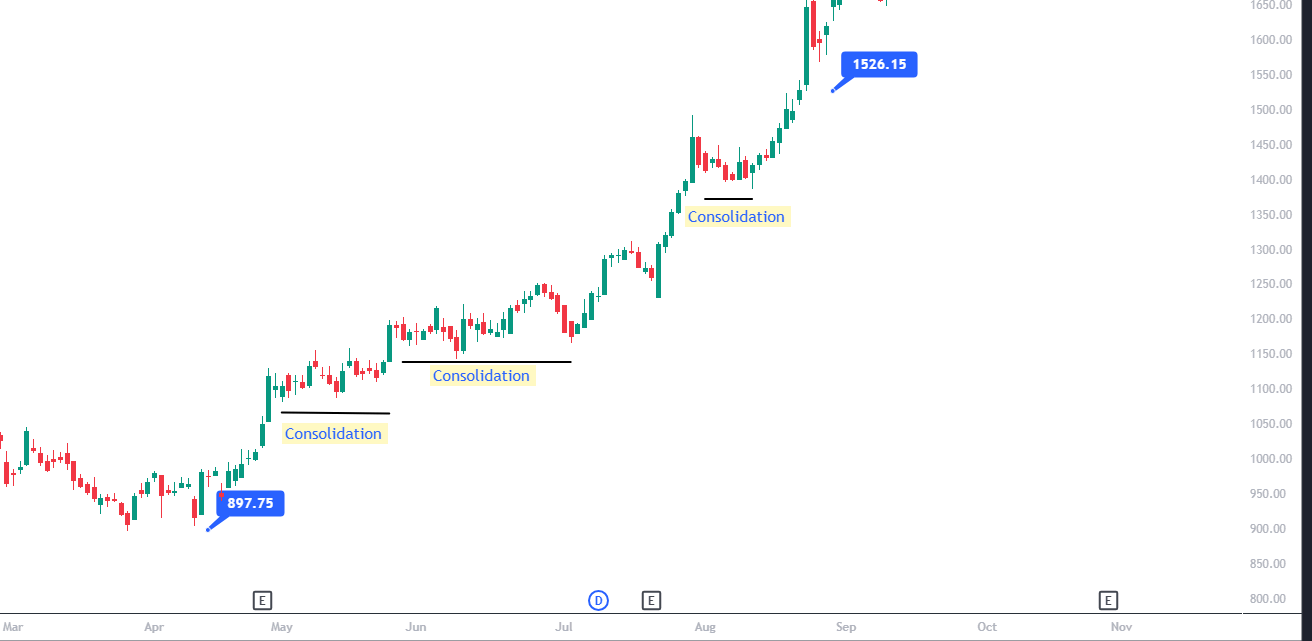
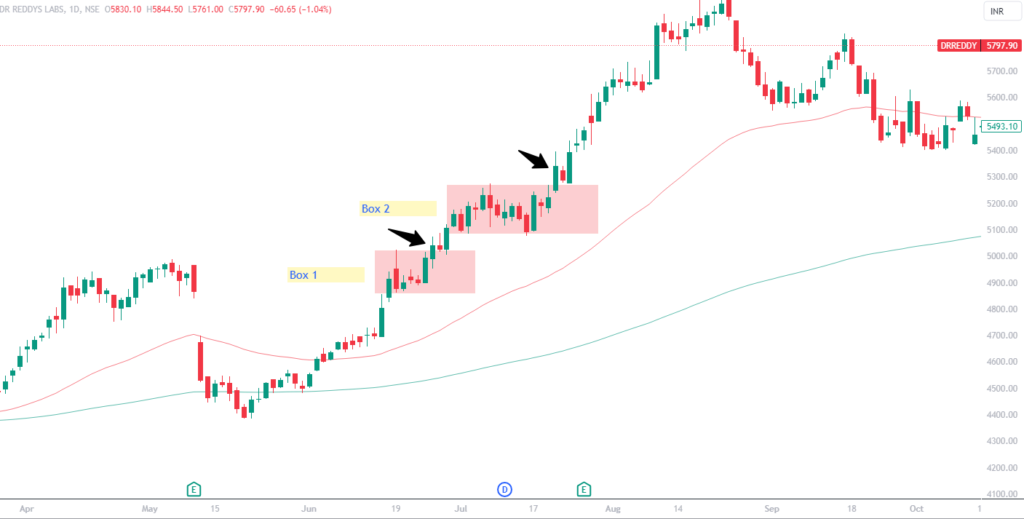
1.Stock prices never gives a large move without a retracement or consolidation in prices. Lets see an example on what we mean by this statement:
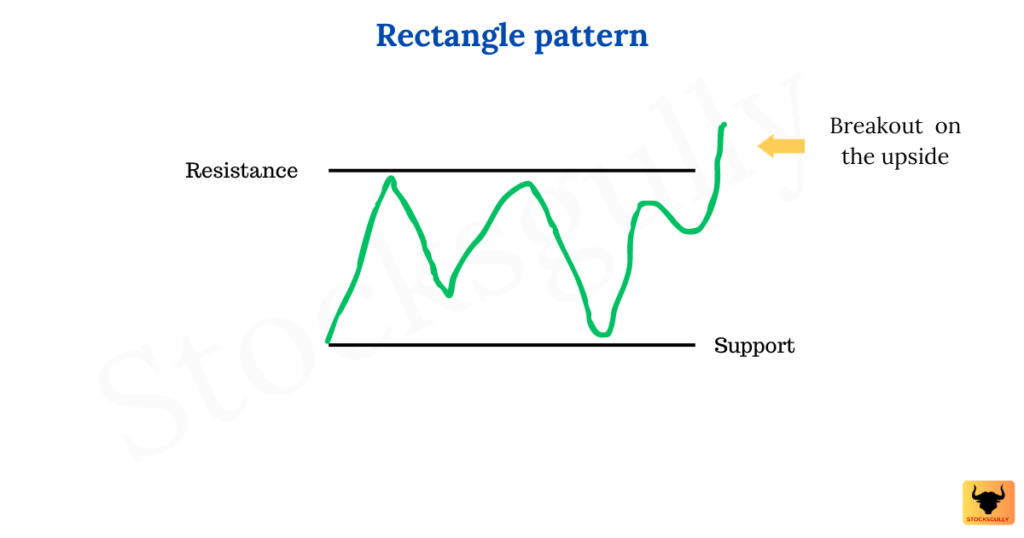
2.This strategy is based on rectangle chart pattern which is a well known continuation pattern in technical analysis . In this , the price consolidates between two levels which are support and resistance and then it gives a breakout in one direction. As we are discussing swing trading , we will look for opportunities where there is breakout on the upside to take long trade
3.This pattern gives a good risk reward ratio and hence it is one of the favourite patterns among swing traders. So if you want to trade on this pattern , you need to keep the stocks which are currently in consolidation phase in your watchlist.
Box Trading Strategy
Selection of Stocks
- Choose Stocks with enough liquidity.
- It can be Large cap, Mid cap, or Small cap stock.
- Now check whether stock is in uptrend on Monthly and Weekly timeframe . Multi timeframe view on the price action will ensure that we will take a high probable trade . There are various ways to see whether prices are in uptrend or not and we will not get into too much detail in this article :
-
- Higher highs and higher lows
- Prices above 200 EMA and 50 EMA ( If both indicator are rising then better )
-
- We will shortlist few potential stocks basis above criteria
Entry Rule
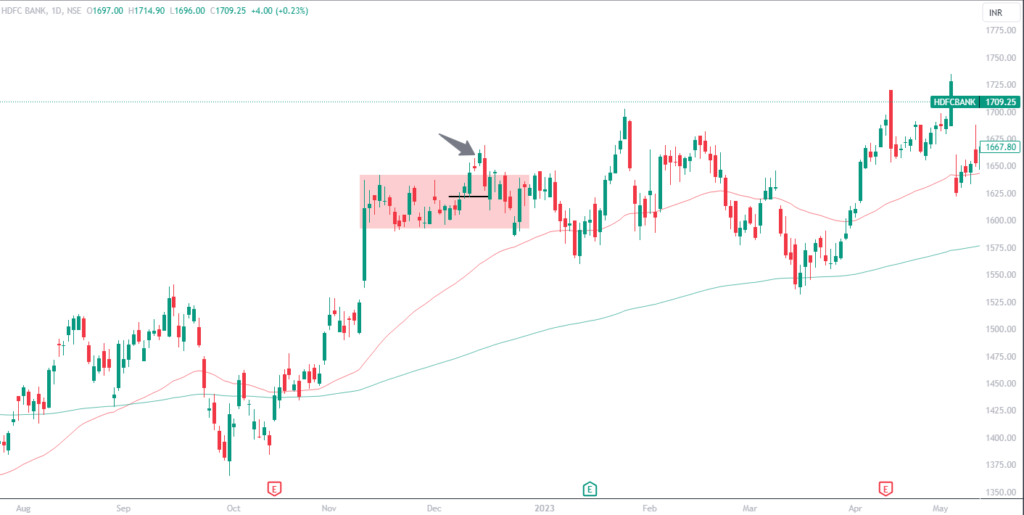
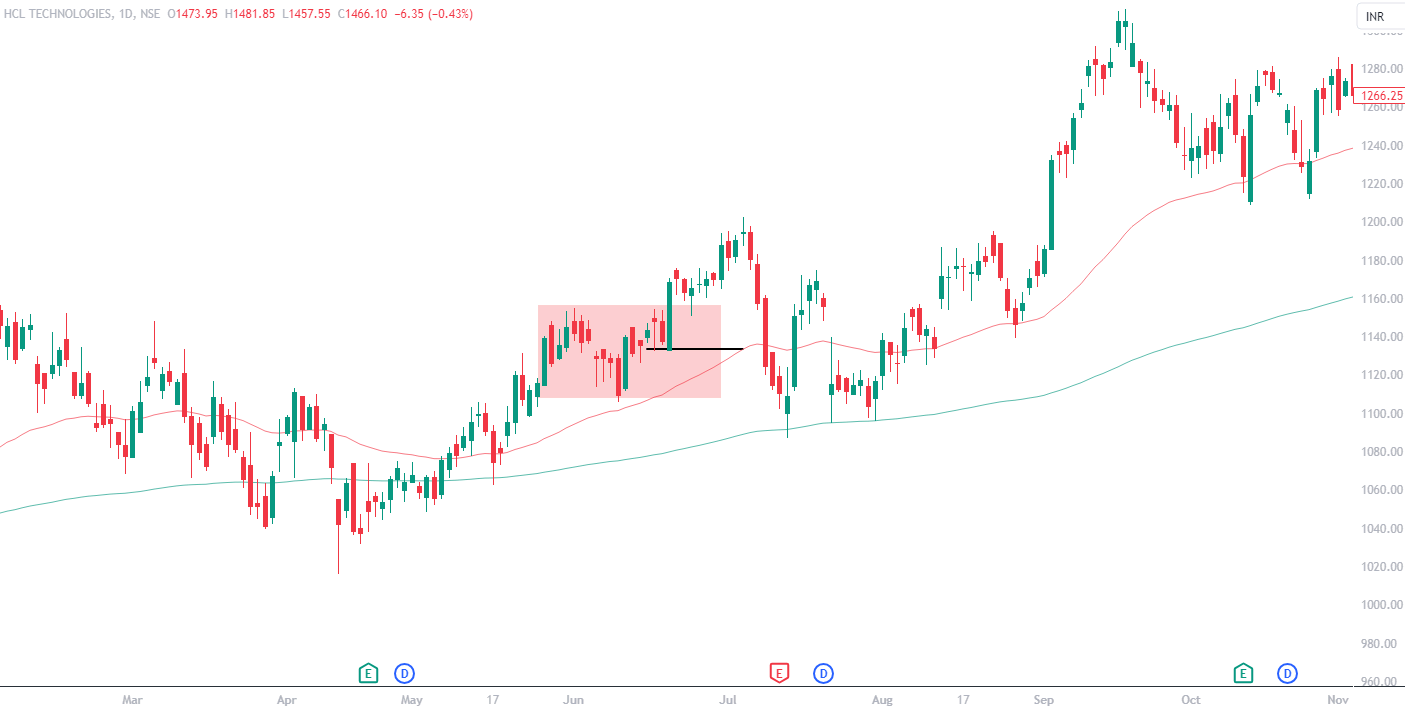
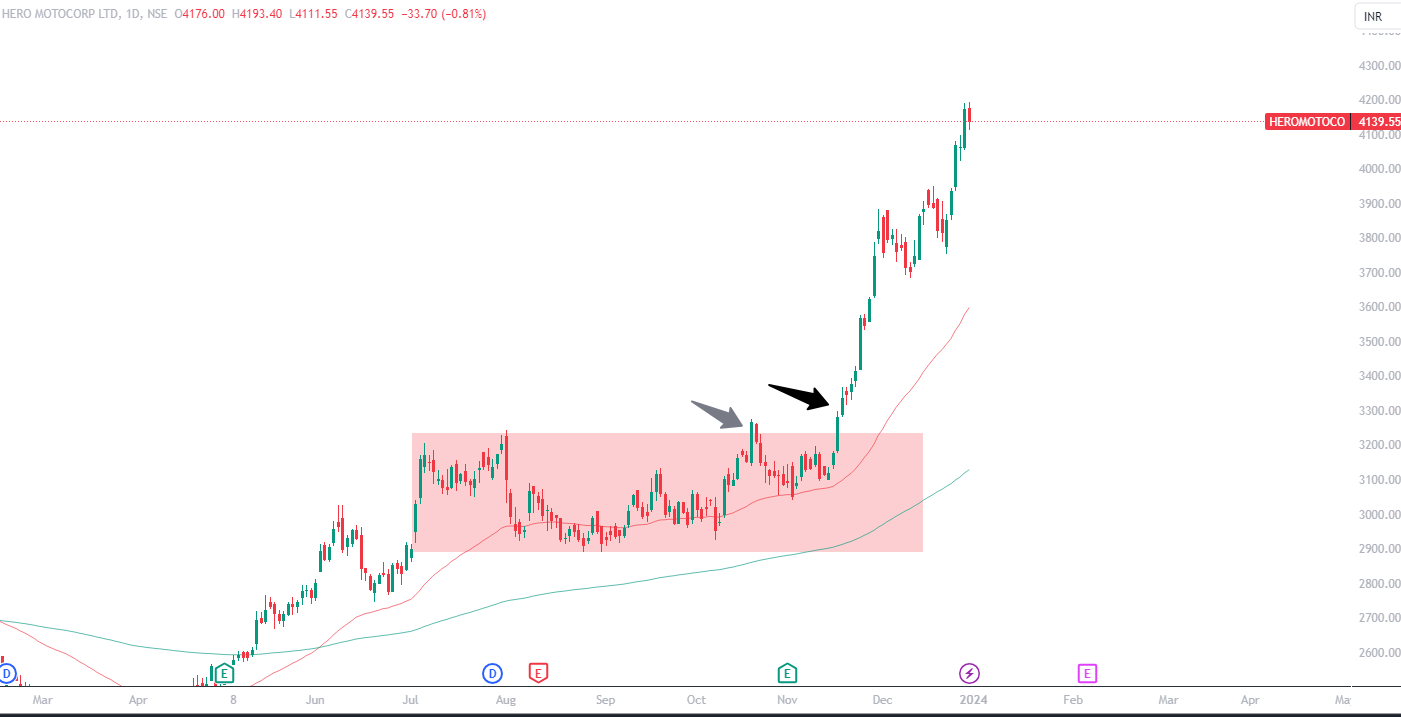
Step 1: After selecting stocks, we will look for support and resistance zone created by that stock . It is the zone where stock will take a pause or consolidate during an uptrend . (* If you dont know how to draw support and resistance , dont worry . Just go through this article and you will get some clarity on this strategy )
Once a green candle close above the resistance , then it becomes out alert/signal candle.
Step 2: We will enter the trade once alert candle high is broken.
Stop Loss
Now let us understand where we will put stop loss in this strategy
The stop loss in this strategy can be kept just below alert candle low . If stock has given fake breakout , then the stop loss will be triggered and we will exit from the stock with a small stop loss.
Exit Rule
There can be two exit rules in this strategy.
Exit rule 1
In this rule , we will keep 1st target as height of the consolidation box . Once 1st target is achieved , we can trail or exit.
Exit rule 2
For this exit rule , we will keep risk reward of 2-3 and hence our target will be atleast double of our risk in the trade. Let’s see this with help of an example
Suppose our Entry price is at 200 Rs and our Stop Loss is at 185 Rs ( This price will be slightly below alert candle low). This means we have a risk of 200-185= 15 Rs in this trade.
Considering risk reward of 2 , we will keep target of around 30 Rs in this trade. So once stock reaches 230 Rs we will exit the trade and look for other opportunities.
Important points to consider basis this setup
- We will focus on price action ( Consolidation phase ) in this setup . 50 and 200 EMA are used to understand whether prices are in uptrend or not.
- It is a kind of setup which has the potential to give you good returns even if you are working in 9-5 job. On weekend’s you can select stocks and keep it in your watchlist. Once entry signal is there, you can enter with fixed Stop Loss and Target during the week.
Any opinions, news, research, analyses, prices, or other information contained on this website is provided as general market commentary for educational purpose only and does not constitute investment advice. StocksGully will not accept liability for any loss or damage including, without limitation, to any loss of profit which may arise directly or indirectly from use of or reliance on such information.
My brother recommended I might like this website. He used to be totally right. This post actually made my day. You cann’t consider just how a lot time I had spent for this information! Thanks!
Thanks a lot for Liking the information. I hope it adds value