
In this “Swing trading strategy: No 2”, we will discuss Rising 50 EMA Strategy. This we can apply when we expect prices to go up.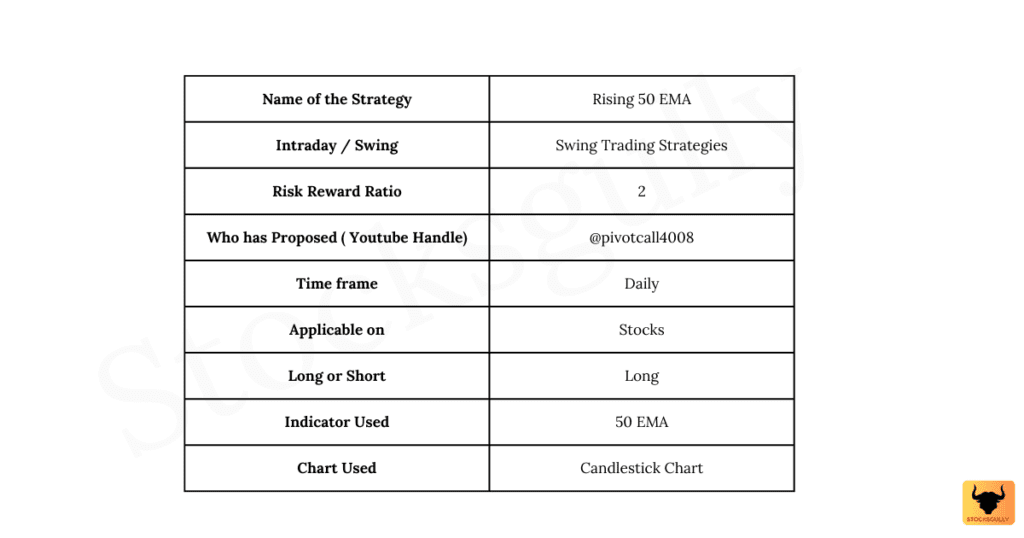
Figure 1: Strategy Table
Concept
- Moving Average is a lagging indicator which means it follows price movement and gives confirmation of an ongoing trend to a trader.
- Daily timeframe is used so that all noise in prices is removed. As you move higher in timeframe, false signals in prices or patterns are less. Daily and weekly timeframe are good for swing and positional trading in stocks.
Rising 50 EMA Strategy
Capital Allocation
A trader should allocate 5-6% of overall capital in one stock. This means if you have 10 lac rupees to allocate, then 50,000 Rs will be allocated to 1 stock and you will have around 20 stocks in the portfolio. Maximum allocation in stock should be around 8-10% if you have great conviction in any stock
Indicator used: 50 EMA
Selection of Stocks
- Choose Stocks with enough liquidity.
- It can be Large cap, Mid cap, or Small cap stock.
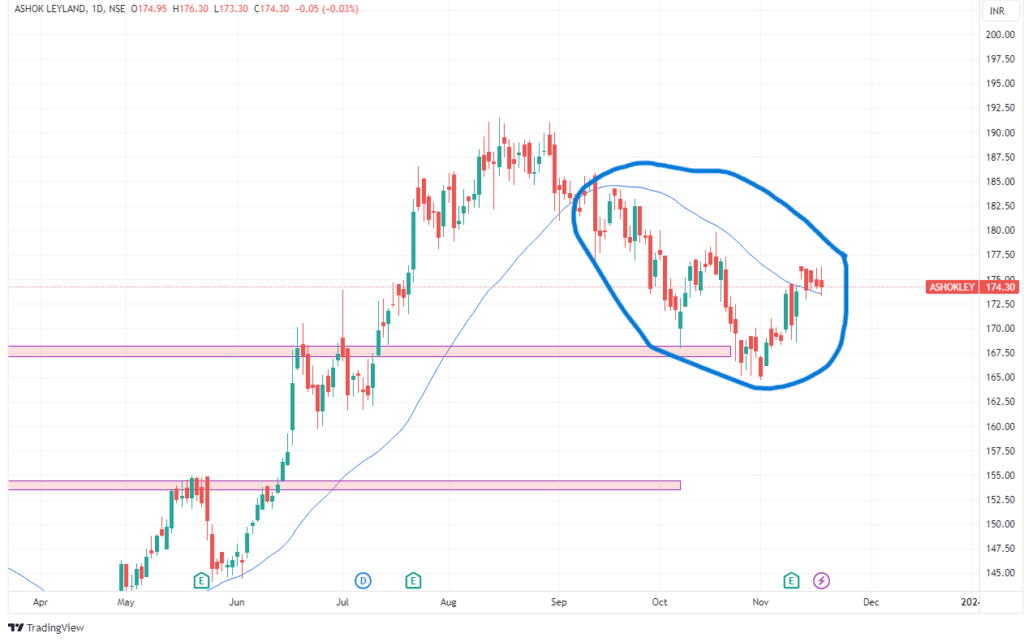
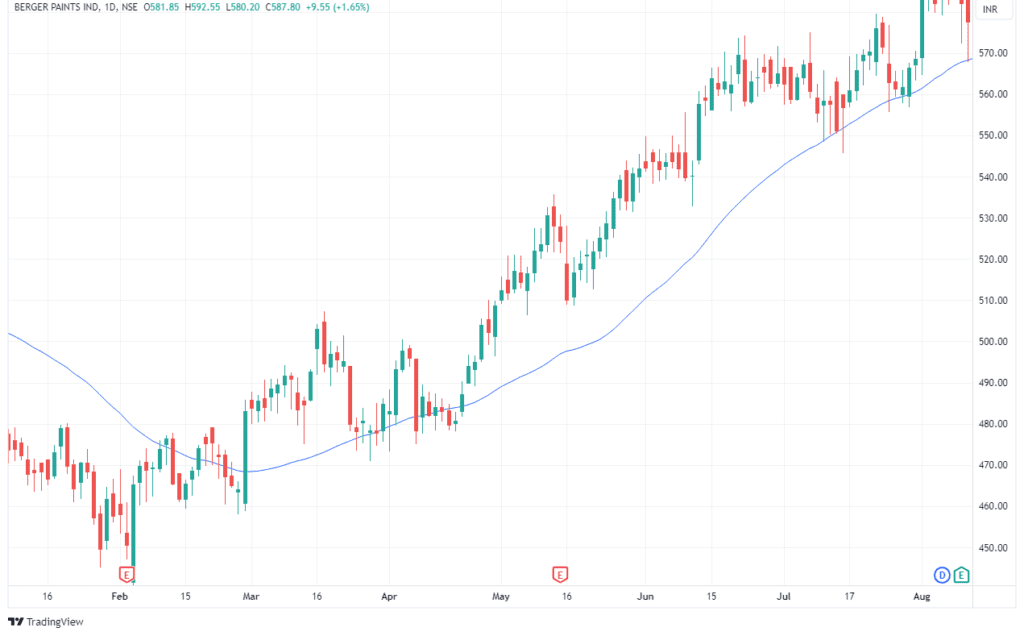
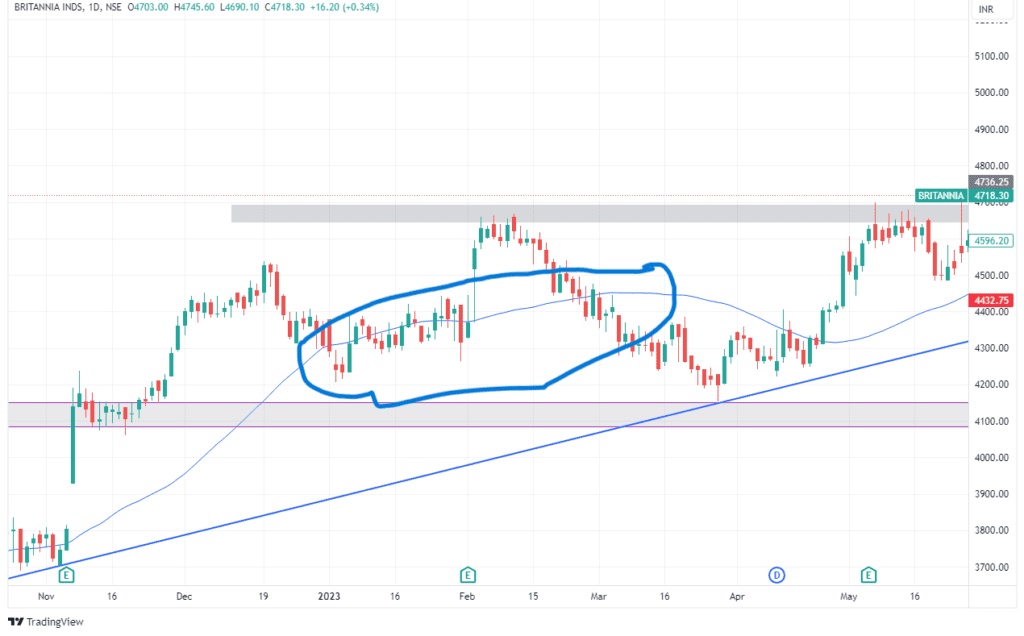
- Now look for stocks where 50 EMA is rising. As discussed in Moving average indicator article , when EMA is rising it means stock is in uptrend. Let’s see some stocks where EMA is rising because this can be confusing to a new trader.
- We will shortlist few potential stocks where EMA is rising.
Entry Rule
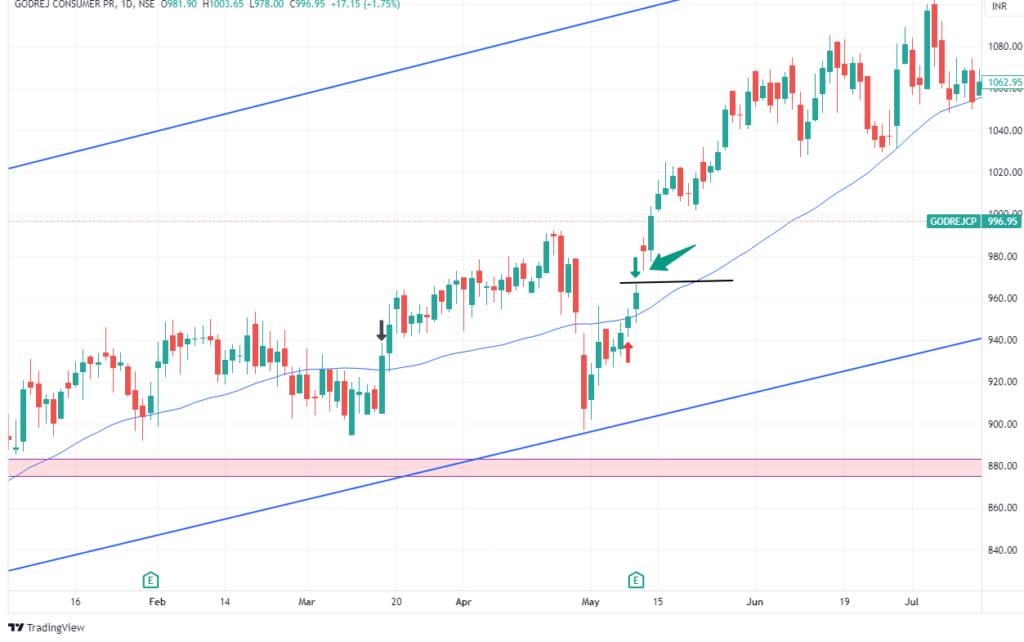
Step 1: After selecting stocks, look for a full body Green candle near 50 EMA. There are two conditions for this candle
- Candle should be of average size and not very large size.
- Candle should close above 50 EMA
If the green candle fulfill above two conditions then this will be our alert/signal candle.
Step 2: Once alert candle high is broken we will enter in the trade.
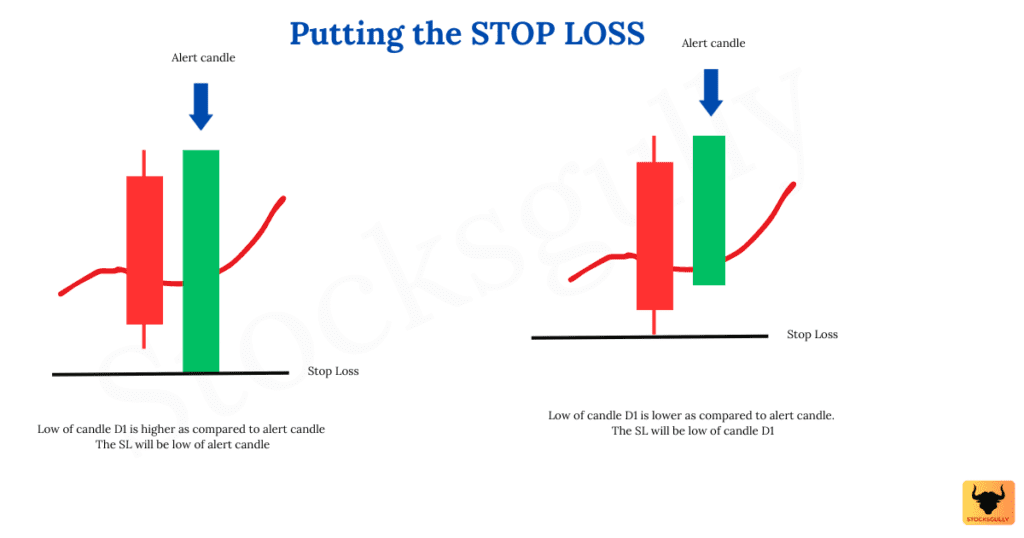
Stop Loss
Now let us understand where we will put stop loss in this strategy
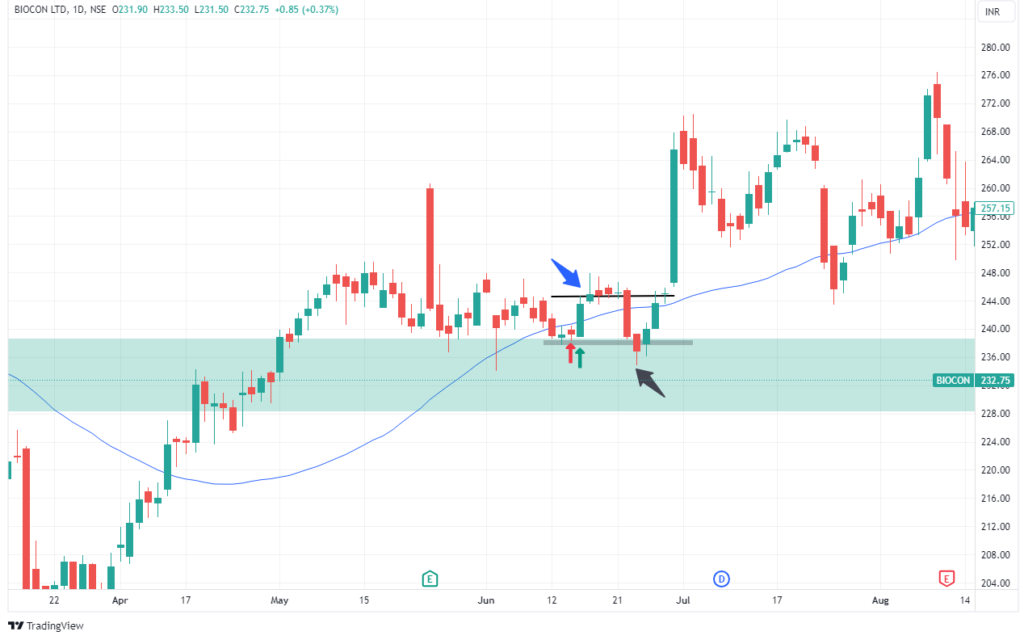
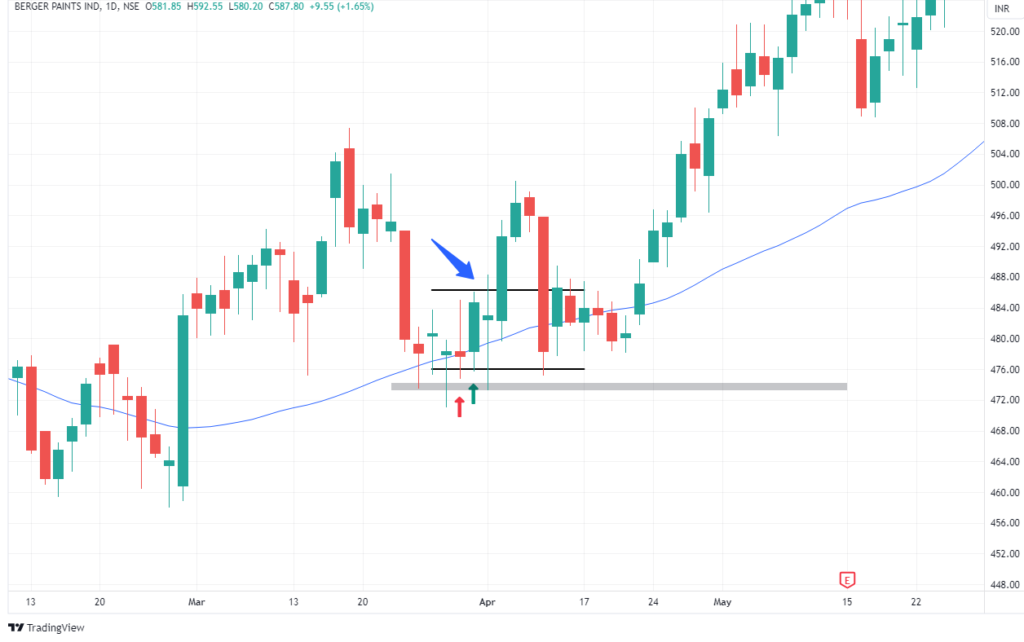
Case 1: If low of the candle prior to alert candle (Let us say it is candle D1) is LOWER than alert candle low. (Confusing 😊 We will see this with the help of diagram)
Stop Loss: It will be low of candle D1. (Just keep it little lower than low of candle D1)
Case 2: If low of the candle prior to alert candle (Let us say it is candle D1) is HIGHER than alert candle low
Stop Loss: It will be low of alert candle .(Just keep it little lower than low of alert candle)
Exit Rule
For this strategy we will keep risk reward of 2 and hence our target will be double of our risk in the trade. Let’s see this with help of an example
Suppose out Entry price is at 100 Rs and our Stop Loss is at 80 Rs. This means we have a risk of 100-80= 20 Rs in the trade.
Considering risk reward of 2 , we will keep target of around 40 Rs in this trade. So once stock reaches 140 Rs we will exit the trade and look for other opportunities.
Important points to consider basis this setup
- We will focus on price action and 50 EMA indicator in this setup.
- It is a kind of setup which has the potential to give you good returns even if you are working in 9-5 job. On weekend’s you can select stocks and keep it in your watchlist. Once entry signal is there, you can enter with fixed Stop Loss and Target during the week.
Any opinions, news, research, analyses, prices, or other information contained on this website is provided as general market commentary for educational purpose only and does not constitute investment advice. StocksGully will not accept liability for any loss or damage including, without limitation, to any loss of profit which may arise directly or indirectly from use of or reliance on such information.