

In this “Swing trading strategy: No 7”, we will discuss “MACD + Price Action Strategy“. This we can apply when we expect prices to go up or down but as we are discussing swing strategy in equity(cash) , we will discuss the rules when prices are expected to go up.
Swing trading strategies can give a very good risk reward ratio as stop loss will be lower and a trader can trail for higher profits.
Concept
In this strategy we will use Price action along with MACD ( Moving Average Convergence Divergence) indicator to take entries . We will be using different exit strategies which we discuss in this article for exiting the trade
The important points to trade on this pattern are :
1. Support and Resistance zone : We will plot Support and Resistance zone in either daily or weekly timeframe to understand the zones where stock prices can take support and go up. Resistance zone can be one of our exit level based on risk reward ratio.
2. A Bullish candlestick pattern at support zones can give more conviction to a trader in taking the trade basis this setup
3. For confirmation and strength in prices , we will be using MACD indicator which helps us in taking good probability trades.
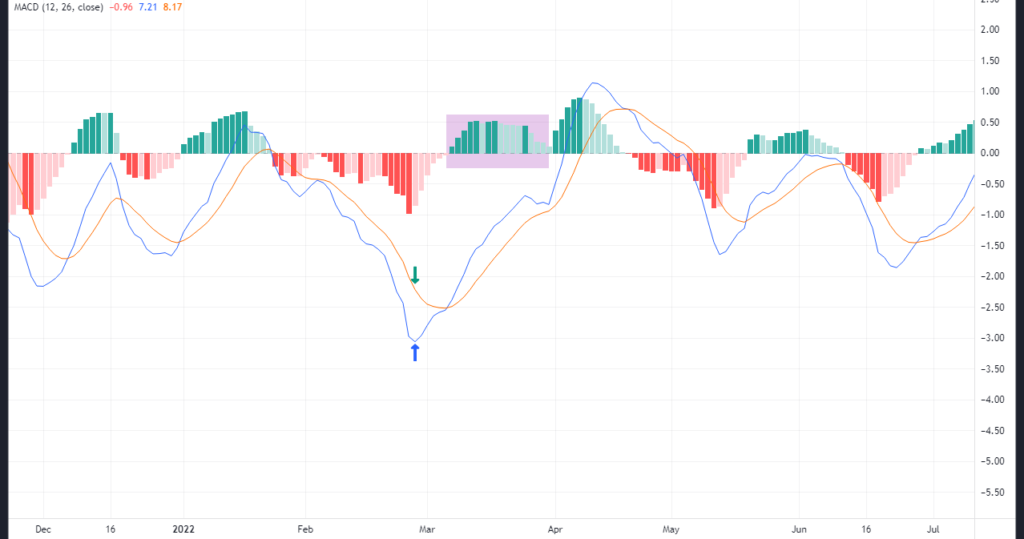
Before getting into the entry and exit rules for this strategy , lets see few pointers on MACD indicator first.
MACD Indicator | Lets Understand this in a Simple Manner
We will be using standard setting for this strategy which means below mentioned settings in the indicator:
Fast length = 12 , Slow length = 26 and signal = 9.(All are EMA’s)
Once you plot this indicator on any charting platform , you will see few things :
- MACD line: This line is plotted by combinations of two EMA ( You can see this in indicator settings ) . It is 12 and 26 in the default settings. We will not get into the mathematical formulas on how it is calculated etc. but MACD line is formed when you subtract 26 EMA from 12 EMA. Don’t worry ! as we dont have to do any subtraction because MACD line is plotted in the indicator automatically.
- Signal line: This is 9 EMA of the MACD Line.
- Histogram: Histogram is the difference between MACD line and Signal line and plotted with red and green bars in the indicator. This means if there is large difference between MACD and Signal line , histogram bars will be bigger . If we understand this from trading perspective , then a larger difference between MACD line and signal line denotes strength in the current trend ( The histogram bars will be bigger in this case ) . Once we see that bars length is getting smaller , it will signal that current trend is loosing momentum.
- 0 line: When MACD and signal line are above the 0 line , it shows good strength in the market . It might be possible that MACD line has crossed signal line below 0 line but when they both move up the 0 line , then its better.
MACD + Price Action | Swing Trading Strategy
Selection of Stocks
- Choose Stocks with enough liquidity.
- It can be Large cap, Mid cap, or Small cap stock.
Entry Rule
Step 1: First mark support and resistance zone on daily or weekly timeframe.
Step 2: Once stock prices are near support zone , check the MACD crossover . There might be 2 cases here :
a) 1st case: MACD cross over has happened already . In this case you enter the trade with SL below support zone
b) 2nd case: MACD crossover has not happened yet but you see MACD line coming near signal line and histogram bars getting smaller which means that crossover might happen soon . We will wait for crossover to happen first and if at crossover our stop loss is under our risk appetite than we can take the trade.
Stop Loss
Now let us understand where we will put stop loss in this strategy
Stop Loss 1: Stop loss in this strategy should be below the support zone because prices can reverse after you enter the trade . Once risk reward of 1 is achieved , you can also trail your profits.
Stop Loss 2: Stop loss can be kept at swing low which will give additional safety to the trade in case a fake breakout of support zone happens.
Exit Rule
In this strategy you can have different exit strategies basis your risk appetite and risk reward ratio.
Exit 1 : You can exit at the resistance zone on daily or weekly timeframe . This might take some time and trader need some patience to see prices reaching the target . You might also see prices moving against your direction of trade and stop loss can also hit
Exit 2: You can also exit once you see the histogram length decreasing ( Which means that trade is loosing momentum ) . In this case we can re-enter basis our entry rules again .
Exit 3: You can exit once MACD line cross signal line from above and moves below the signal line ( Which means now prices can move down ).
Lets see some Examples :
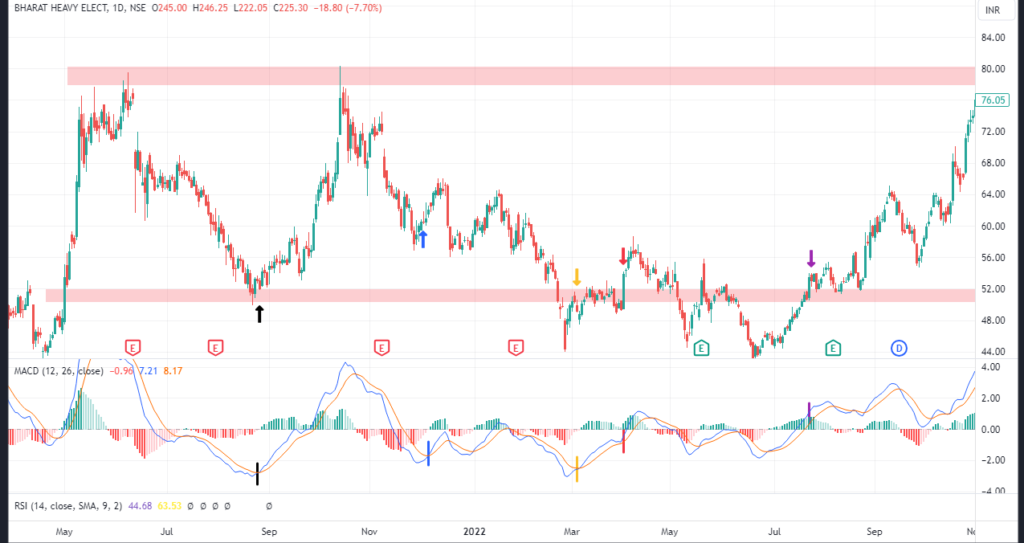
Example 1 : In this chart , support and resistance zone are marked on daily timeframe. Entry and exit are also on daily timeframe.
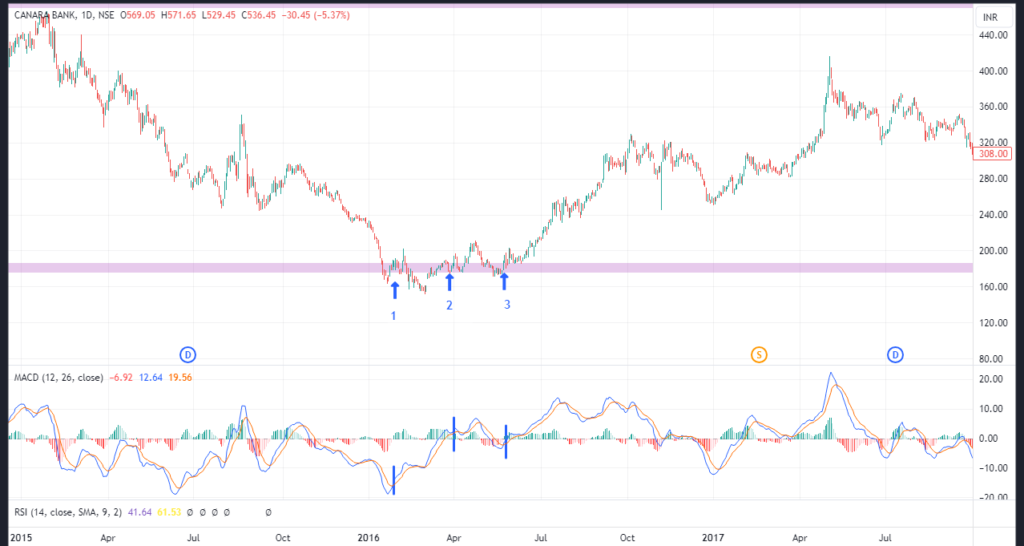
Example 2 : In this chart , support and resistance zone are marked on Weekly timeframe. Entry and exit are on the daily timeframe.
Important points to consider basis this setup
- You might enter and exit the trade multiple times in this setup as MACD indicator can give a sell signal during retracement move.
- We are not considering entry using only MACD indicator as its a lagging indicator which can also give false or late signals.
- If you are plotting resistance and support zone in weekly timeframe then entry and exit can happen in daily timeframe. The stop loss might be more in this case but target will be much bigger as compared to stop loss . As a trader , always maintain risk reward ratio.
- Its very important to mark the support and resistance zone correctly for this setup.
Any opinions, news, research, analyses, prices, or other information contained on this website is provided as general market commentary for educational purpose only and does not constitute investment advice. StocksGully will not accept liability for any loss or damage including, without limitation, to any loss of profit which may arise directly or indirectly from use of or reliance on such information.