
In this “Intraday trading strategies: No 8”, we will discuss “VWAP Mean Reversion strategy”. This you can apply when you expect prices to move up or down basis indicator and price setup.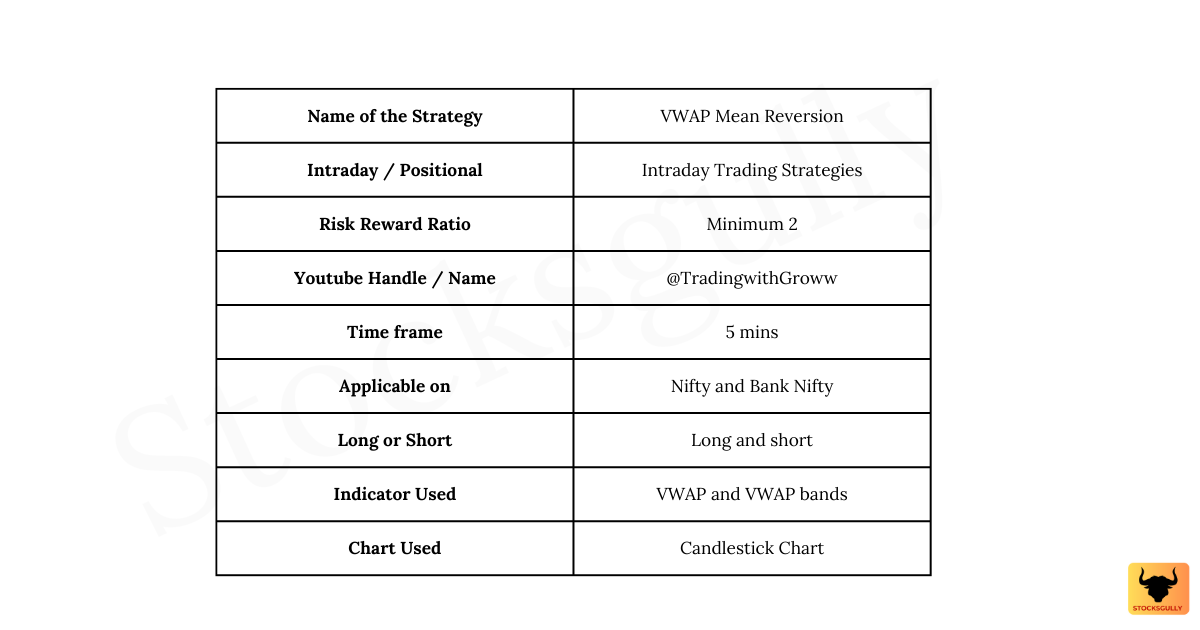
Concept
1.VWAP line is “volume weighted average price” line which includes prices and volume for calculating the average price. This means if prices move up along with rise in volume, the VWAP line will also move up.
2.If prices are above VWAP line, it means market sentiments are Bullish and if prices are below VWAP line then it means sentiments are Bearish
3. When prices move very far from VWAP line , then there are chances that price will come back to the VWAP line. This happens because price has a tendency to come back to the average . In this strategy , average is the VWAP line and when price move away from VWAP then we will wait for reversal to VWAP line for taking the trade.
4. To identify whether prices have moved far away from VWAP for a potential reversal , we will use VWAP Bands.
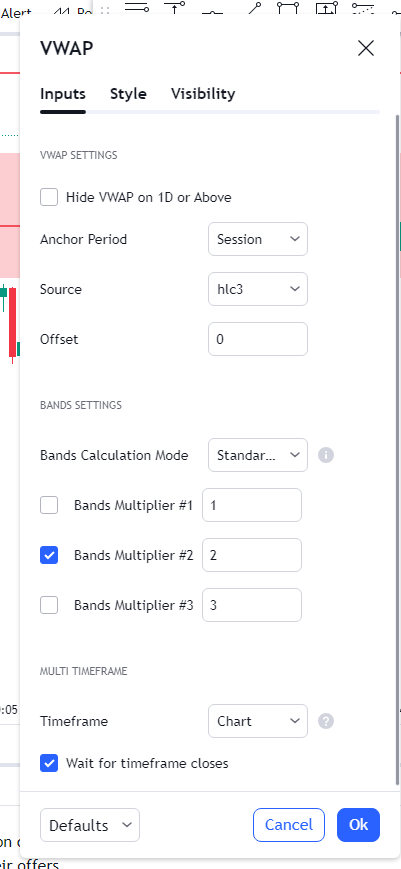
Brief about VWAP Bands indicator:
This indicator and strategy works on the same concept which we had discussed in Bollinger Band Strategy.
VWAP Bands also creates a price envelope which has an Upper Band and a Lower Band. Price moves within these bands for 95% of the time ( We will keep standard deviation of 2 in this indicator )
Once price is closed above the VWAP Upper Band , it means there are chances that prices will come back to VWAP line and prices may move down. Similarly , when prices is closed below VWAP Lower Band , it means there are chances that prices will come back to VWAP line and prices may move up.
VWAP Mean Reversion Strategy
Entry Rule
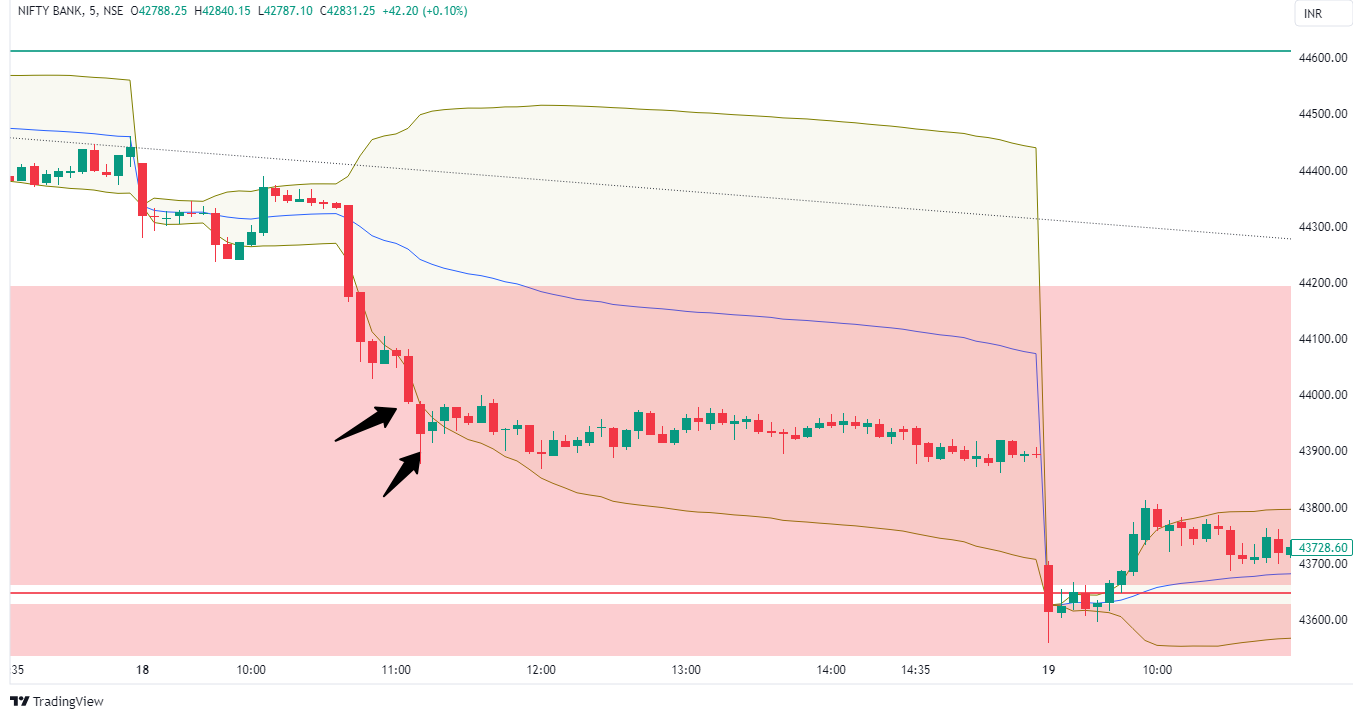
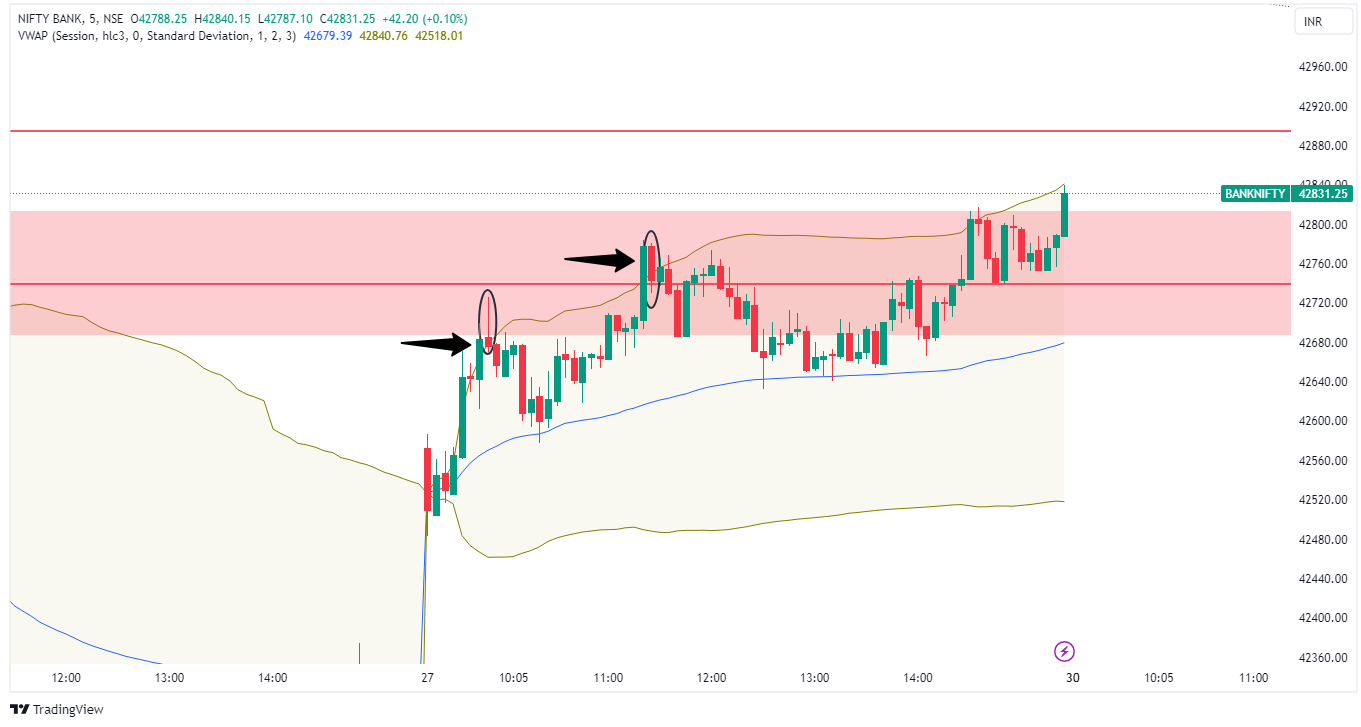
Step 1: First, we need to wait for prices to close below or above the VWAP bands. This means that we will wait for deviation in prices. If prices are moving near “Lower VWAP Band” then we will wait for a Red candle to close below Lower VWAP band . Similarly if prices are moving near “Upper VWAP band” then we will wait for a Green candle to close above VWAP band.
Step 2: After you have identified deviation in “Step 1”, will wait for “signal candle” to take short or long trade.
Note : Signal candle is the candle where a trader is ready to take the trade.
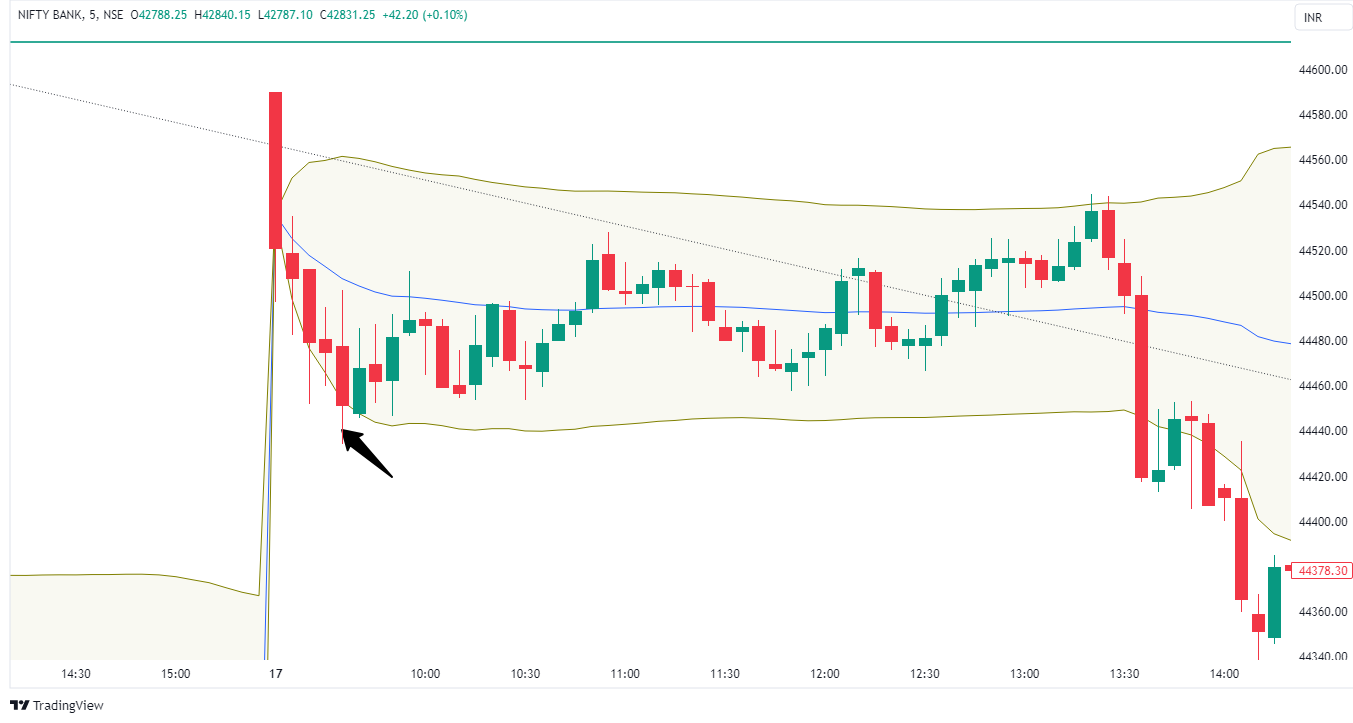
Long trade: If price closed below Lower VWAP Band with Red candle , signal candle is the green candle which is closed inside VWAP Band. We will enter if next candle cross the high of signal candle
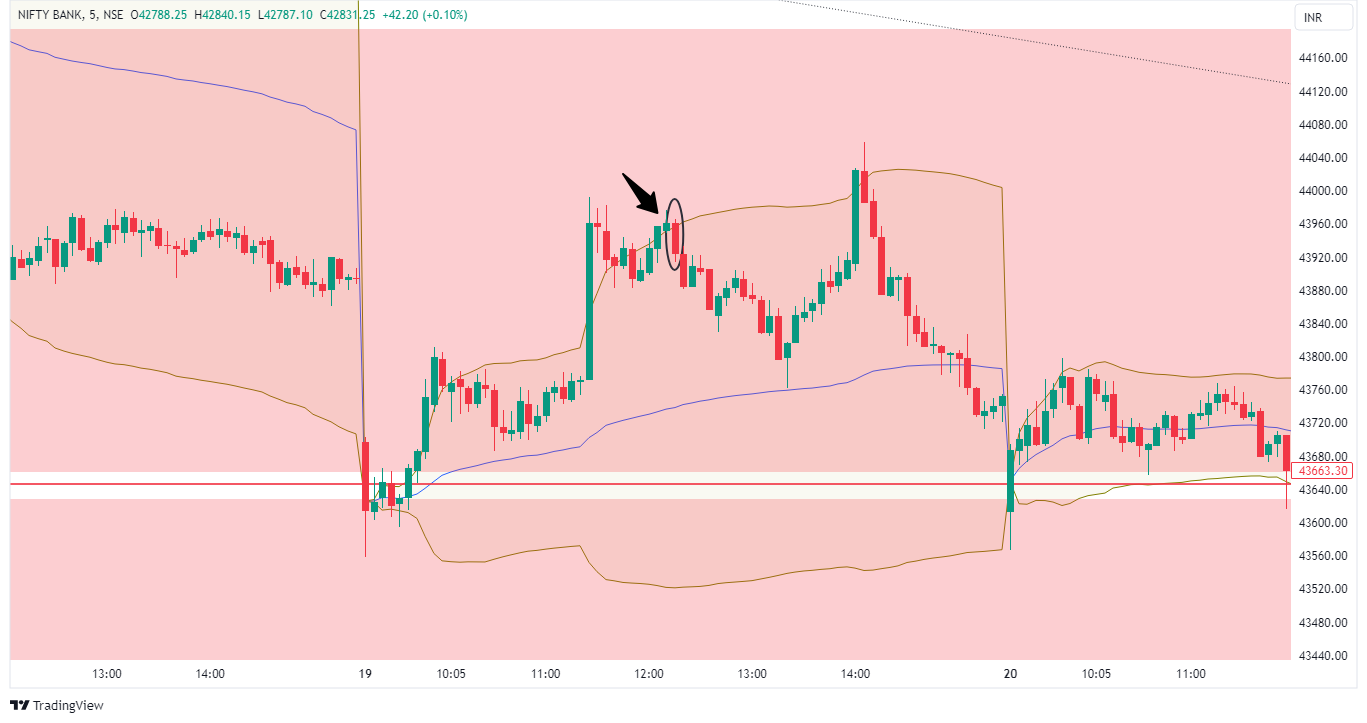
Short trade: If price closed above Upper VWAP Band with Green candle , signal candle is the red candle which is closed inside VWAP Band. We will enter if next candle cross the low of signal candle.
Step 3: Once signal candle is identified, final step is to calculate the risk reward of the trade.
The stop loss in this setup is the signal candle low and target is VWAP line . If the risk reward is around 2 , then we will enter the trade otherwise we will leave this trade and look for this setup again.
Reward : Distance between closing of signal candle and VWAP line (As this is your first target)
Risk : The length of the signal candle is the stop loss.
Stop Loss
In this strategy stop loss is maximum 100 points( Bank Nifty) on spot chart ( This means around 50 Rs in “At the money” call option ) or entry candle low. Suppose if signal candle low is 70 points on spot chart , then you can put 70 points as your stop loss. For Nifty , Stop loss will be around 50 points.
Exit rule
We will try to keep risk reward of around 2 in this setup . So there are some options you can consider to take exit
- Take exit once prices touch VWAP line ( This you should exit even if risk reward of 2 is not achieved . It happen sometimes that prices have moved on the chart but options prices have not increased much)
- You can also trail after getting 2 risk reward ( In case prices have either crossed VWAP line or didnt touch it )
Backtesting
Always backtest the strategy before taking actual trades in market. The strategy should suit your trading style and psychology.
Any opinions, news, research, analyses, prices, or other information contained on this website is provided as general market commentary for educational purpose only and does not constitute investment advice. StocksGully will not accept liability for any loss or damage including, without limitation, to any loss of profit which may arise directly or indirectly from use of or reliance on such information.