In this “Intraday trading strategies: No 6”, we will discuss Bollinger Band Intraday Strategy. This we can apply when we expect prices to go up or down basis price and indicator setup.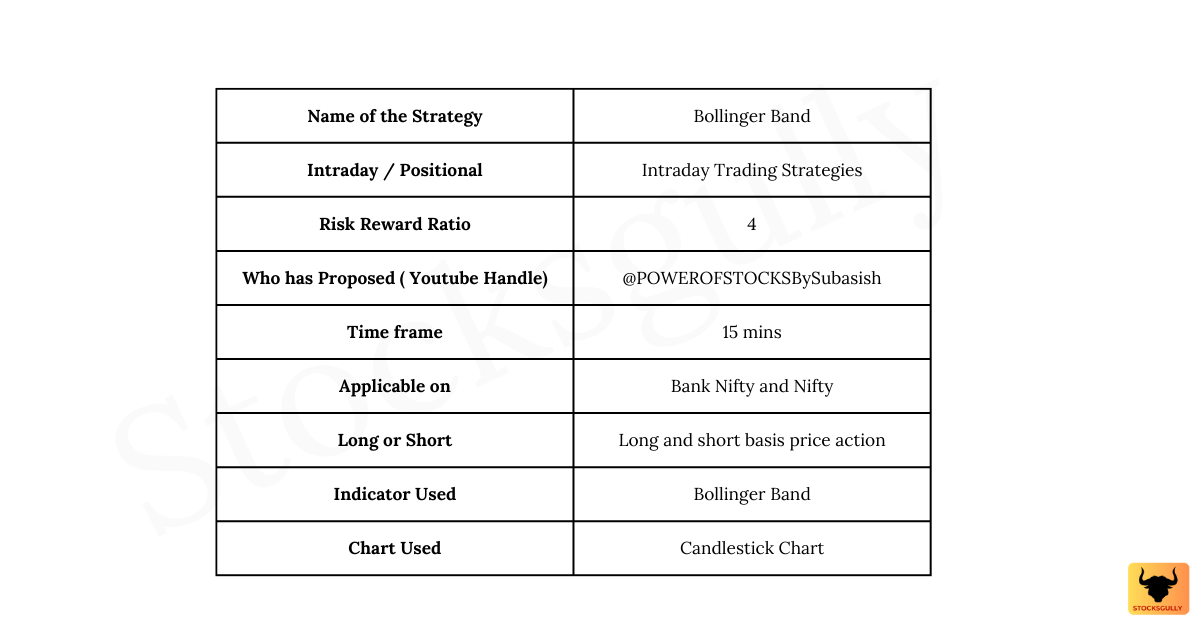
Brief about Bollinger Band Indicator:
Before getting into concept along with entry and exit rules, lets quickly go through this indicator in brief. If you already know about Bollinger Band Indicator , then you can directly jump to concept and rules for entering and exiting the trade.
1.Bollinger Band indicator is like a price envelope which has an upper band and a lower band. Based on the indicator settings, price move within the band most of the times.
2.Bollinger Band use 2 parameters
Period: This is the period of moving average that a trader can set . If value is 20 , it means its a 20 period moving average
Standard deviation: This is the standard deviation from mean prices (Mean prices here is 20 period moving average). Default settings is standard deviation of 2 in which you can assume that prices will remain between the band around 90% of the time. Standard deviation is an estimate by which prices can deviate ( Go up or down ) from the mean.

3.If you decrease the standard deviation of Bollinger Band , chances of prices remaining between the band decreases .
Lets see this with a table

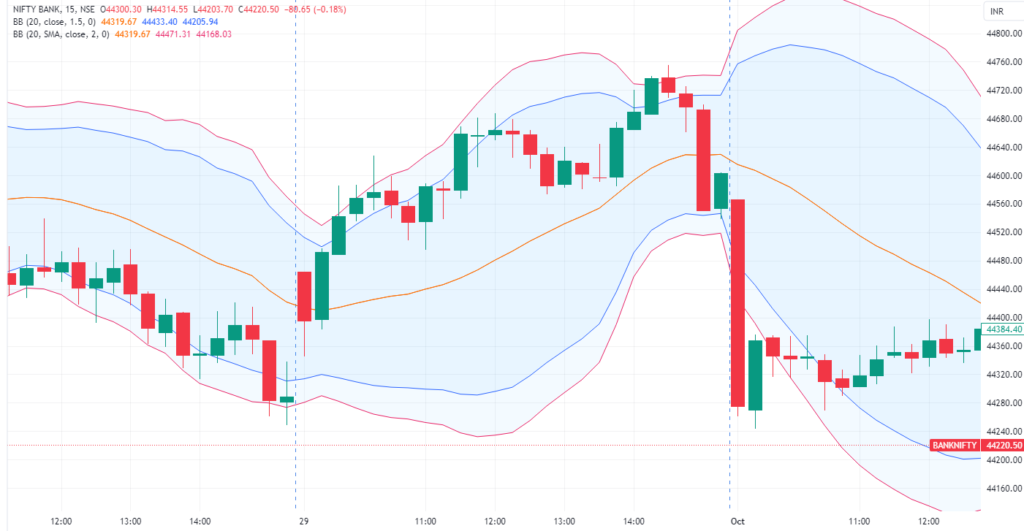
4.When you put Bollinger Band indicator on charting platform , it will have moving average line along with Upper and Lower Band .
I hope you have understood the parameters of this indicator now , so lets go through the Strategy.
Concept
- When prices go above the upper band of Bollinger or below the lower band of Bollinger then there is deviation in prices.
- If prices are touching or moving above the upper band , it means market is very bullish and its in Overbought zone. Similarly , when prices are touching lower band or moving below it , this means market is bearish and market is in Oversold zone.
- Once market is overbought and if Bearish candlestick pattern is formed , there are high chances that market will come down. The same is true when market is oversold and Bullish candlestick pattern is formed in which prices might go up .
- In this strategy , we will wait for price deviation and then take trade as per entry and exit rules . If you have gone through 5 EMA strategy , then this strategy is easier to understand.

Bollinger Band settings
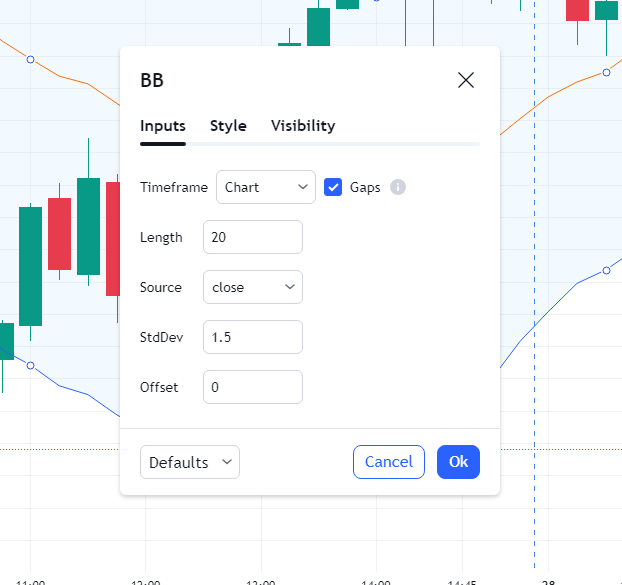
We will use period of 20 and standard deviation of 1.5. We are using standard deviation lesser than 2 because we want price deviation to happen more so that we get the trade setup . If we use larger values of standard deviation then most of the times prices will remain between the Bollinger Band and we will not get the trade.
Short trade : Buying PE or selling CE
Entry rule:
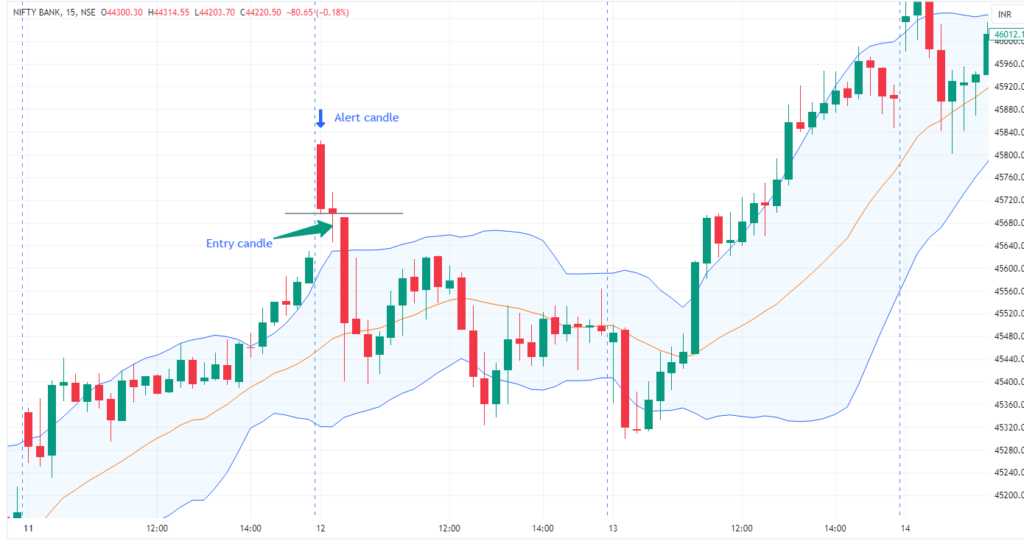
Step 1: First, we need to find the alert candle. Any candle which is above upper band and does not touch it is our alert candle. Make sure that low of the candle (Even if it’s a wick) should not touch upper band.
Step 2: Once you find the alert candle (Let’s name this candle “Alert 1”), check how the next candle is formed (Let’s name this candle “Next 1”.)
- If next candle (Next 1) breaks the low of alert candle (Alert 1), then it is our entry candle (Next 1 = Entry candle). You can enter the trade when it breaks the low of alert candle (Alert 1)
- If next candle (Next 1) does not break the alert candle (Alert 1) low, then it means the next candle (Next 1) low is higher than alert candle (Alert 1) low. In this case Next 1 becomes Alert 1. This means that next candle is now the new alert candle. As alert candle is changed, we need to follow Step 2 again
If you go through Step 1 and Step 2 again , after alert candle is formed , Next 1 either become Alert candle or Entry candle .I hope the entry, exit and stop loss is clear to you now . You can comment in case of any question.
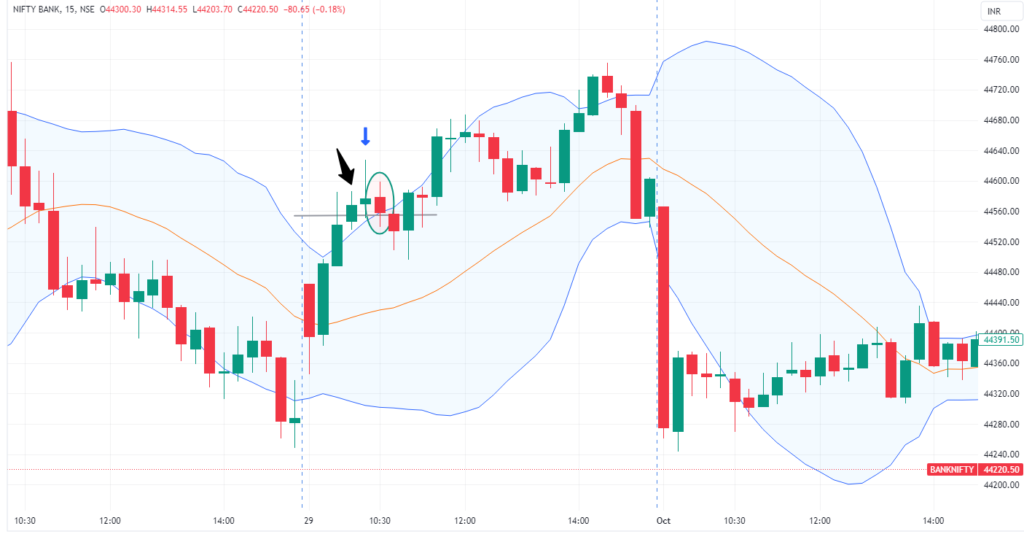
Stop Loss
In this strategy stop loss is maximum 100 points( Bank Nifty) on spot chart ( This means around 50 Rs in “At the money” call option ) or nearest swing high. Suppose if nearest swing high is 70 points on spot chart , then you can put 70 points as your stop loss. For Nifty , Stop loss will be around 50 points or nearest swing high.
Exit rule
We will keep risk reward of around 4 in this setup, so take exit once you get the risk reward.
Long trade : Buying CE or selling PE
In Long trade , the rules will slightly change as now we will look for deviation in prices below lower band.
Entry rule:
Step 1: First, we need to find the alert candle. Any candle which is below the lower band and does not touch it is our alert candle. Make sure that high of the candle (Even if it’s a wick) should not touch lower band.
Step 2: Once you find the alert candle (Let’s name this candle “Alert 1”), check how the next candle is formed (Let’s name this candle “Next 1”.)
- If next candle (Next 1) breaks the high of alert candle (Alert 1), then it is our entry candle (Next 1 = Entry candle). You can enter the trade when it breaks the high of alert candle (Alert 1)
- If next candle (Next 1) does not break the alert candle (Alert 1) high, then it means the next candle (Next 1) high is lower than alert candle (Alert 1) high. In this case Next 1 becomes Alert 1. This means that next candle is now the new alert candle. As alert candle is changed, we need to follow Step 2 again
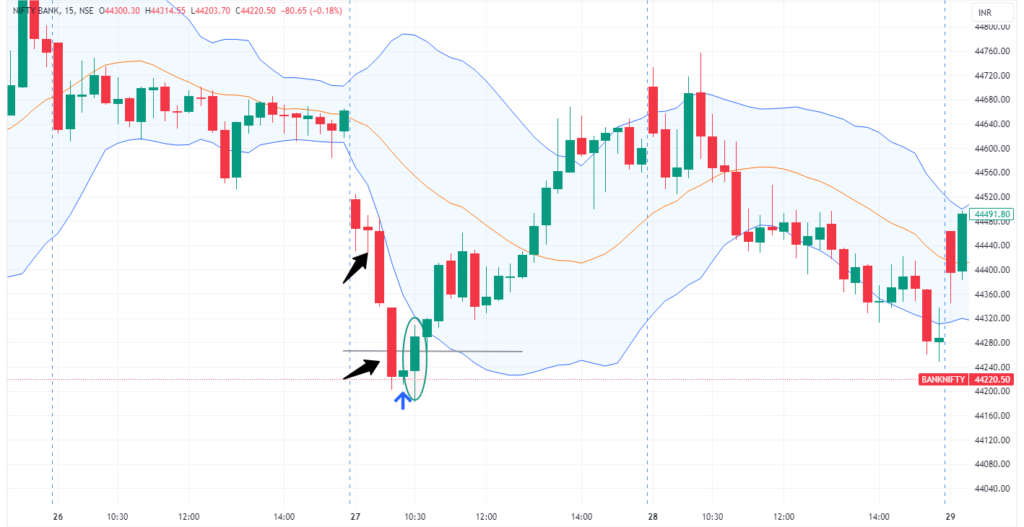
Stop Loss
Stop loss is maximum 100 points( Bank Nifty) on spot chart ( This means around 50 Rs in “At the money” call option ) or nearest swing low. Suppose if nearest swing low is 70 points on spot chart , then you can put 70 points as your stop loss. For Nifty , Stop loss will be around 35 points or nearest swing low.
Exit rule
As risk reward is minimum 4, so take exit once you get the risk reward.
Important points to consider basis this setup
- This setup will not form very frequently in the markets and hence a trader need huge patience to wait for the right entry. This might not suit full time traders but for people who are currently in 9-5 job , it might be helpful as this setup will not happen every day.
- As risk reward is 4 , so you have to patiently wait for profits to come.
Backtesting
Always backtest the strategy before taking actual trades in market. The strategy should suit your trading style and psychology.
Any opinions, news, research, analyses, prices, or other information contained on this website is provided as general market commentary for educational purpose only and does not constitute investment advice. StocksGully will not accept liability for any loss or damage including, without limitation, to any loss of profit which may arise directly or indirectly from use of or reliance on such information.

