
Moving averages is a great tool/indicator used in technical analysis to catch trends. In this “Intraday Trading Strategies : No 13” , we will build a setup that will help an intraday trader to catch the trend and try to achieve a good Risk Reward Ratio.
Concept
A trader likes to catch the trend early and ride it as long as possible. Like all other intraday setups and strategies that we have discussed before , we will be trading in a 5 mins time frame for this strategy also.
- A smaller length moving average reacts faster to change in prices . E.g: 8 EMA (Exponential MA) moving average will react to the prices faster as compared to 20 EMA . As we are trading intraday, so we want to catch the trend earlier and hence a smaller length moving average should be part of our strategy.
- When the moving average has an upward or downward slope then we know that prices are either in trend or it can trend sooner.
- Once a smaller length moving average ( Say 8 EMA ) crosses a larger length moving average ( Say 20 EMA ) , then a trader gets a signal that momentum has shifted and a trend can be observed now .
If you want to know how to use moving averages in trading , then go through this article for complete clarity .
Lets see an example where a trader can go long ( CALL side )
a) Suppose prices are below 8 ema for some time and 8 EMA is near 20 EMA . As prices are below 8 EMA , sentiments are bearish as per price action. Now 8 EMA crosses 20 EMA with a bullish green candle closing above 8 EMA . If prices sustain above 8 EMA then it means a shift in trend and you can see a momentum in upward direction.
b) Moving averages act as a dynamic moving resistance ( in case of downtrend ) or support ( in case of uptrend ) .
c) To fully understand this strategy , a trader should also know the concept of fake breakout : A fake breakout happens when prices break support or resistance with a candle ( Either close below support or above resistance) and immediately reverses . In fake breakouts , the breakout traders gets trapped and a good price momentum happens opposite to the direction of breakout
Moving average momentum crossover
We will discuss this strategy for going long ( Buying a CALL option ) . The strategy for buying a PUT option remains the same ( The same concept will apply)
Entry rule
Step 1 : 8 EMA and 20 EMA should be sloping upwards ( For buying CALL option ) or sloping downwards ( For buying PUT option )
Step 2: 8 EMA should be above 20 EMA indicating that in short term prices are bullish now
Step 3 : Price should be trading above 8 ema and 20 ema which indicates a bullish trend
Step 4 : A red candle should close below 8 ema indicating that support is broken ( 8 EMA is like a moving support ) . In the next few candles ( In next 2-3 candles at most , If it’s immediate next candle then better ) , prices should close above 8 ema . This will be our “Entry candle”. Sometimes a red candle doesnt close below 8 EMA but next green candle opens below 8 EMA and close above 8 EMA. We can consider this candle also as an “Entry candle”
*Prices should remain above 20 EMA indicating that on a larger duration prices are bullish.
Step 5: In step 4 , all the breakout traders will get trapped as
- 8 EMA is above 20 ema
- Prices have now again closed above 8 ema
- All the traders who took the position at red candle which closed below 8 ema , will exit ( SL get hit ) getting a momentum of prices in opposite direction
Stop Loss
The Stop loss can be set at entry candle low for this strategy . Hence SL will not be very large .
- In case of the green candle which formed after a fake breakout is large , a trader can wait for retracement till 8 ema and then enter. ( The risk will become smaller in this case )
Exit
There can be various exit strategies basis risk appetite of the trader 👍
- You can exit after getting risk reward of 2
- Trail the stop loss until prices close below 5 ema (You need to put 5EMA also in the chart for this)
- Exit if prices has reached a supply / resistance zone in larger timeframe.
Lets see some Examples
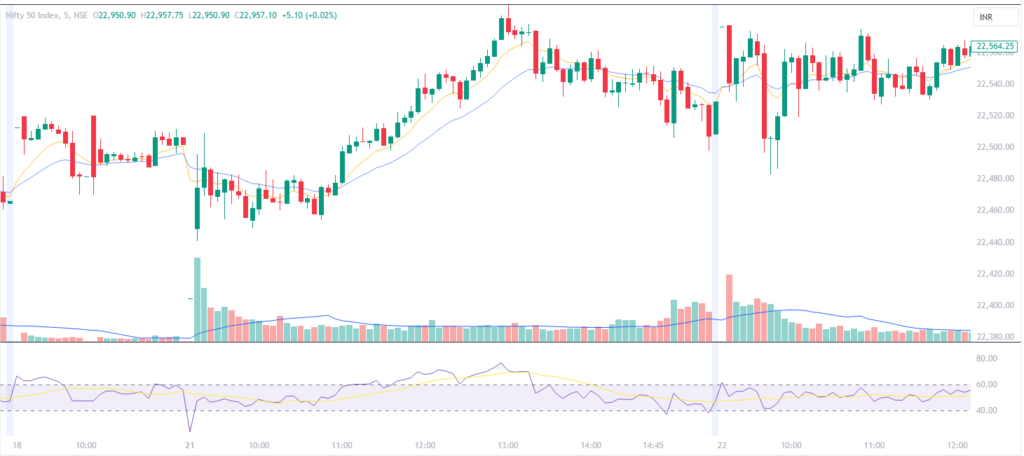
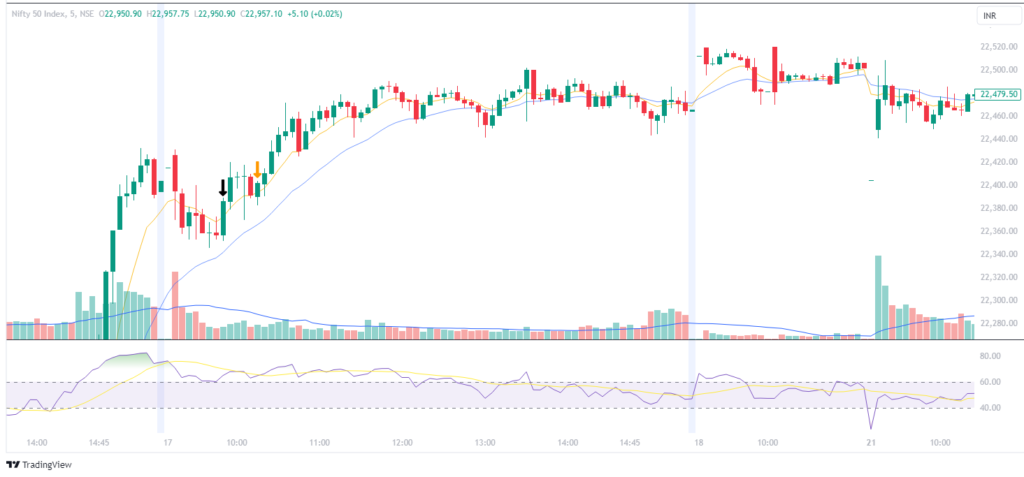
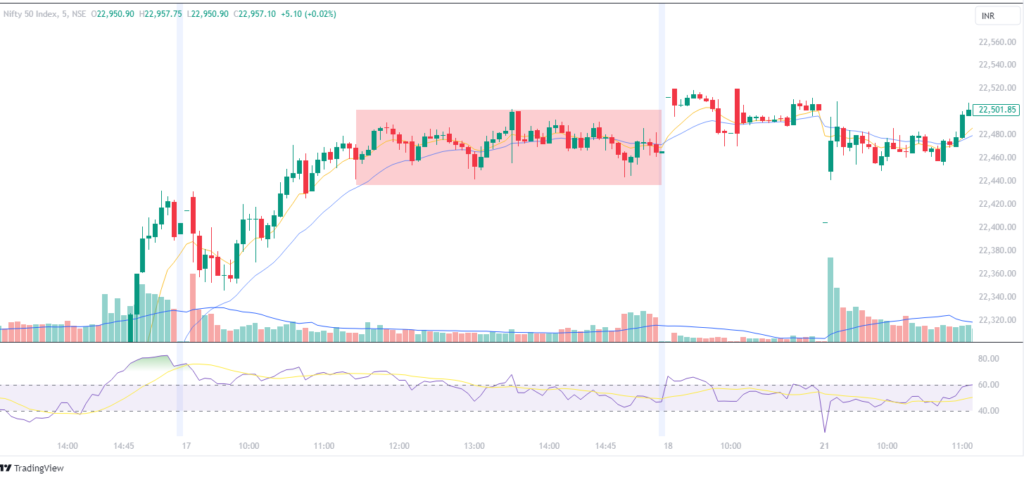
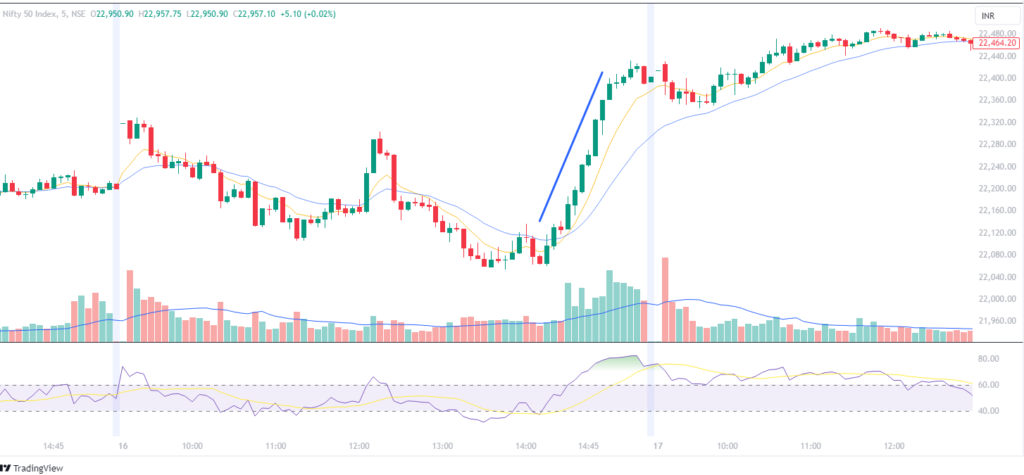
1.Nifty in 5 mins timeframe | Intraday
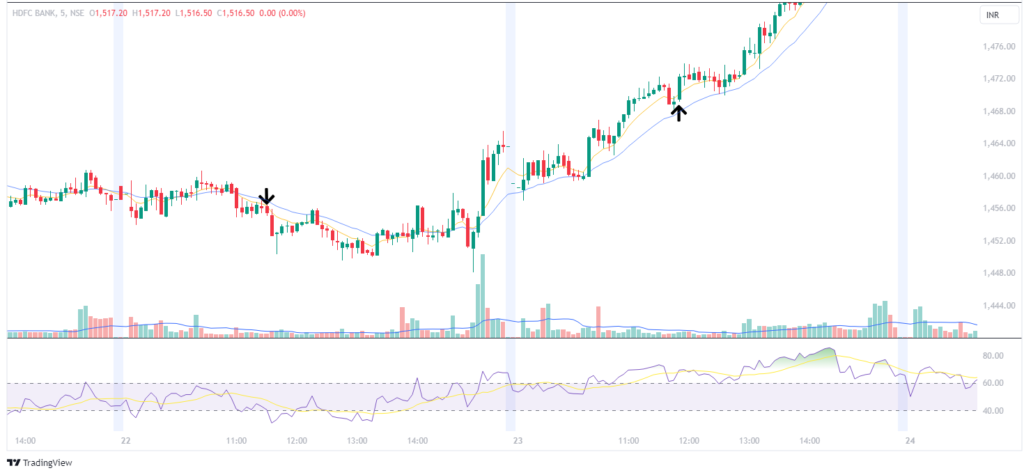
2. HDFC in 5 mins timeframe | Intraday
Important points to consider basis this setup
- This setup works in Nifty , Bank Nifty and stocks.
- There might be frequent stop loss ( If market is sideways ) and hence trader should stop trading if stop loss is hit 3/4 times to avoid overtrading.
- If one observe past movements of Nifty and Bank Nifty , trend comes in first 1-2 Hrs or after 1PM . So a traders can choose to take trades in these time period only. ( To avoid overtrading )
- If “Entry candle” is very big then its better to wait for some retracement .
- If the trend becomes very strong , then you might not get the entry as per this setup. This happens because in a very strong trend , prices will only touch and take support from 8 EMA and not close below the same.
Backtesting
Always backtest the strategy before taking actual trades in market. The strategy should suit your trading style and psychology.
Any opinions, news, research, analyses, prices, or other information contained on this website is provided as general market commentary for educational purpose only and does not constitute investment advice. StocksGully will not accept liability for any loss or damage including, without limitation, to any loss of profit which may arise directly or indirectly from use of or reliance on such information.