In this “Intraday Trading Strategies : No 11”, we will discuss “Camarilla R3 and S3 strategy“. This we can apply when we expect prices to go down or up basis price action.
Brief about Camarilla Pivot points:
Camarilla pivot point is a leading indicator which provide Support and Resistance levels to a trader. We will not get into mathematical formulas as indicator in trading/charting platform will calculate these levels automatically. If you want to see formulas on how different levels are calculated , then you can search on web as it is easily available.
There are 4/5 levels of Resistance (R1 to R5) and 4/5 levels of Support levels ( S1 to S5 ) when you plot camarilla pivots . Basis settings of the indicator , some indicators on camarilla calculate 4 levels and some calculate 5 levels . The indicator which we will use calculates 5 levels. There is also a level called as central pivot ( Indicated by P ) but we will not use it.
Note : When you will use this indicator on trading view , resistance level ( R1 to R5 ) can also be named as ( H1 to H5 ) and support level ( S1 to S5 ) can also be named as ( L1 to L5 ) . [ H means “High” and L means “Low” ]. I refer them as R which means resistance and S which means support .

R3,R4 resistance level and S3,S4 support level are most important levels for a trader and also for Entry and Exit strategies in the setup that we will discuss in this article.
Concept
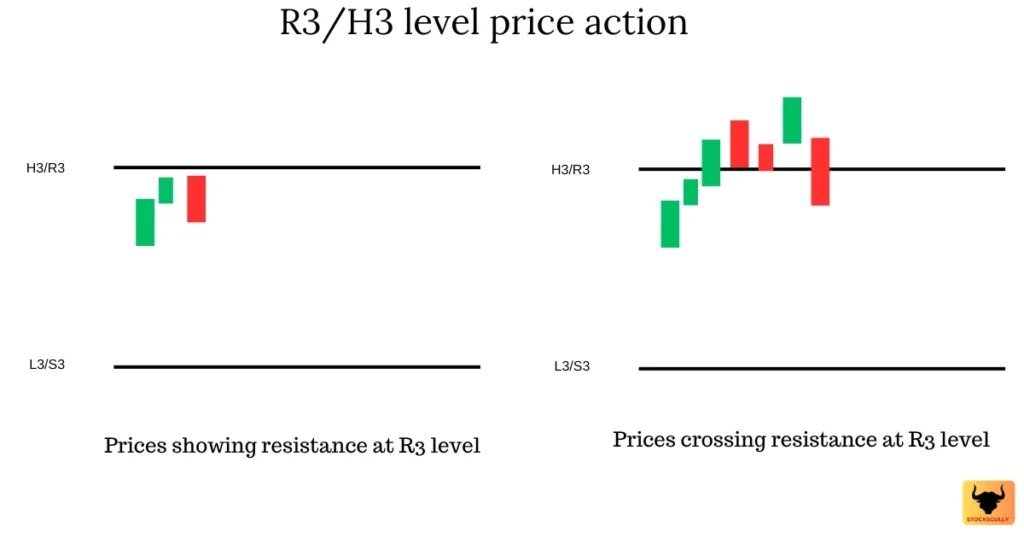
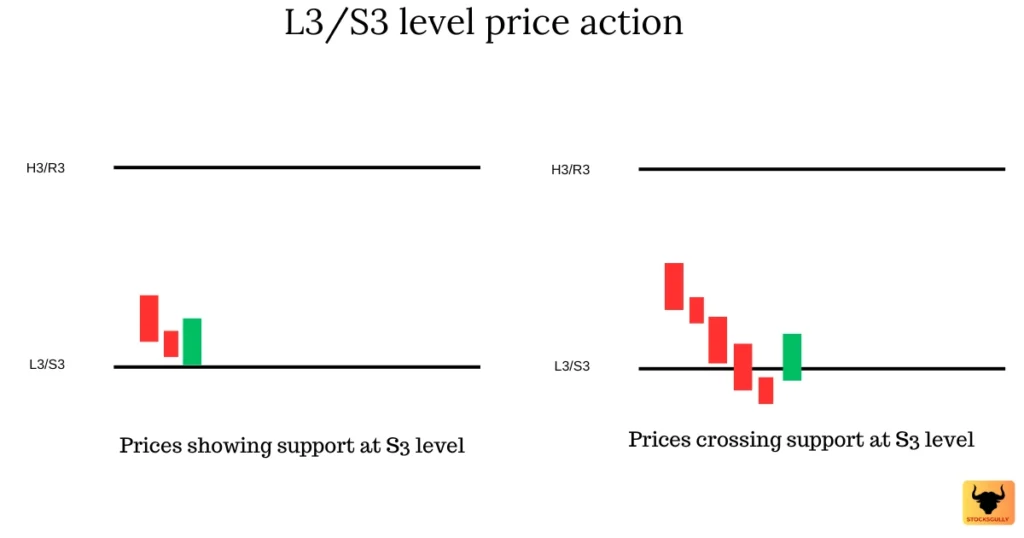
- When prices reach near R3 , prices are likely to face Resistance and when prices reach near S4 , prices are likely to take the Support at that level.
- Once we see prices taking resistance at R3 or crossing R3 ( closing below R3 ) with a red candle and also closing below 20 EMA ( This is for confirmation and taking a high probability trade ) , we can go short ( Take a PUT )
- Once we see prices taking support at S3 or crossing S3 with a green candle ( closing above S3 ) and also closing above 20 EMA (This is for confirmation and taking a high probability trade ) , we can go long ( Buy a CALL )
Camarilla Pivot settings
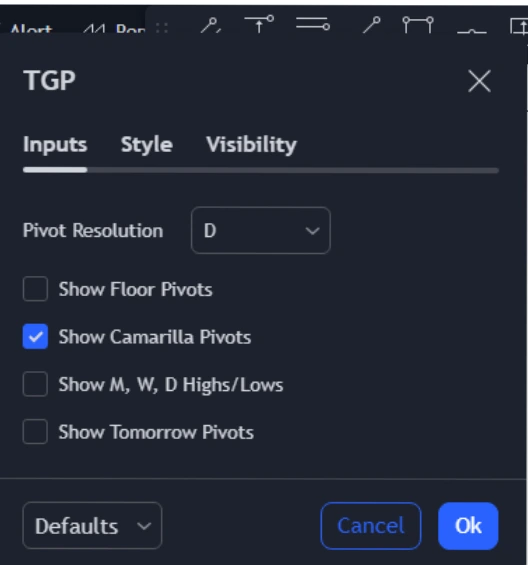
1. Search for TGP indicator ( The Golden Pivots ) in trading view.
2. Go to the settings and uncheck all the box and let only ” Show camarilla points ” box be checked. Pivot resolution will be D which means daily for intraday trading.
3. In Style you can color the R3 and S3 level differently so that one prices come to that zone you are ready for entry as per setup
CAMARILLA R3 and S3 Strategy
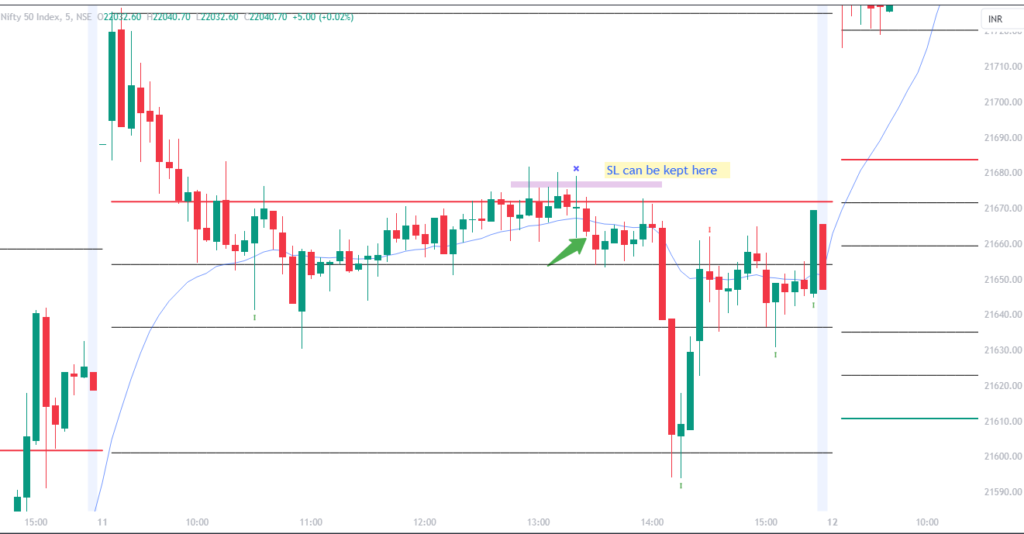
Short Trade : Buying PE
Entry rule:
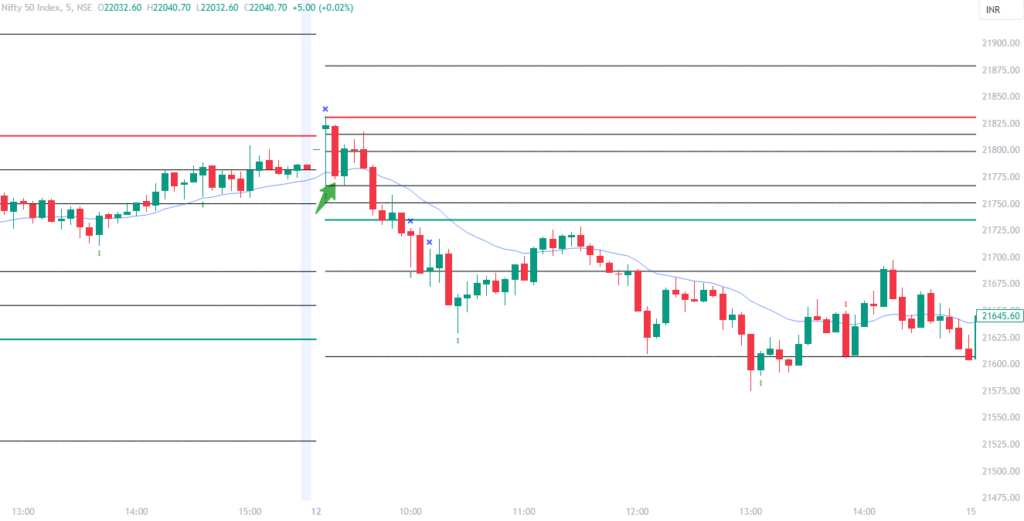
Step 1: First we need to wait for prices to come near R3 levels or cross with a red candle from R4-R3 zone and close below R3.
Step 2: Now check whether prices also closed below 20 EMA.
If prices satisfy both Step 1 and Step 2 then we can enter the trade at ATM.
Stop Loss
In this strategy we can keep the stop loss at entry candle high (Swing high is better than candle high) or you can keep around 10-20 Rs in NIFTY and 40-50 Rs in Bank Nifty . These values can change basis your risk appetite and risk reward ratio that you want to target for your trades.
Exit rule
We will use S1,S2 and S3 levels for exiting from the trade . The first target will be S1 , second will be S2 and third and final target will be S3 levels . The risk reward ratio will be between 1 to 3 for this strategy .
Stocksgully Tip
- If S1 level is less than your risk in the trade , you can trail profits . E.g. : – Suppose your stop loss is 15 Rs and once prices reach S1 level , you are getting only 13 Rs ( Which means a risk reward less than 1 ) , then you can trail profit and let prices reach S2 . If it reverses from S1 level then you can exit on cost to cost.
Long Trade : Buying CE
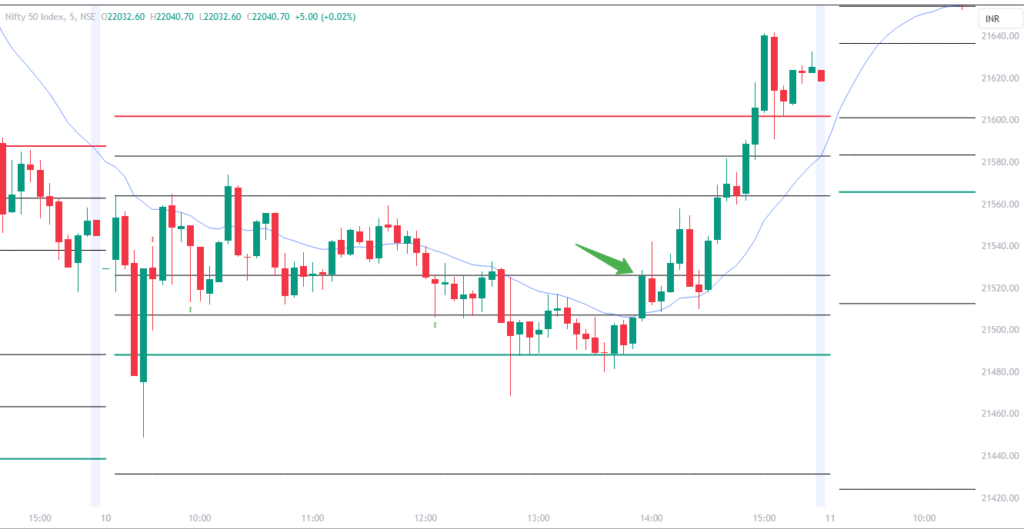
Entry rule:
Step 1: First we need to wait for prices to come near S3 levels or cross with a green candle from S4-S3 zone and close above S3
Step 2: Now check whether prices also closed above 20 EMA .
If prices satisfy both Step 1 and Step 2 then we can enter the trade.
Stop Loss
In this strategy we can keep the stop loss at entry candle low(Swing low is better than candle low) or you can keep around 10-20 Rs in NIFTY and 40-50 Rs in Bank Nifty . These values can change basis your risk appetite and risk reward ratio that you want to target for your trades.
Exit rule
We will use R1,R2 and R3 levels for exiting from the trade . The first target will be R1 , second will be R2 and third and final target will be R3 levels .The risk reward ratio will be between 1 to 3 for this strategy .
Stocksgully Tip
- If R1 level is less than your risk in the trade , you can trail profits . E.g. Suppose your stop loss is 15 Rs and once prices reach R1 level , you are getting only 13 Rs ( Which means currently risk reward less than 1 ) , then you can trail profit and let prices reach R2( At R2 your risk reward will become more than 1 ). If it reverses from R1 level then you can exit on cost to cost.

Backtesting
Always backtest the strategy before taking actual trades in market. The strategy should suit your trading style and psychology.
Any opinions, news, research, analyses, prices, or other information contained on this website is provided as general market commentary for educational purpose only and does not constitute investment advice. StocksGully will not accept liability for any loss or damage including, without limitation, to any loss of profit which may arise directly or indirectly from use of or reliance on such information.

for intraday which time frame is suitable for this setup. 20 Ema of which time frame daily or which we using for intraday setup
Timeframe depends on risk you are willing to take .
5 and 15 min timeframe is good for intraday and catch small momentums