In this “Intraday Trading Strategies : No 10”, we will discuss “VWAP Inside Bar Candlestick Strategy“. This we can apply when we expect prices to go down or up basis price action.
Concept
This strategy use combination of two concepts , for which we have already discussed some trading strategies in previous articles.
1st concept : VWAP ( This helps us in market direction for this setup )
First we need to identify whether to take long trade or short trade ( CE or PE ) and for this we will use VWAP indicator. As discussed in last article
1. If prices are above VWAP line, it means market sentiments are Bullish and if prices are below VWAP line then it means sentiments are Bearish.
2. So when prices are above VWAP we will look for CE opportunities and if prices are below VWAP , then we will look for PE opportunities.
2nd concept : Inside Bar candlestick pattern ( This helps us in entry and exit )
We have already studied Inside Bar scalping where we have used 1 min timeframe but in this strategy we will use 5 mins timeframe. The concept and entry style will remains the same. The important points to trade this pattern is :
1. Inside candle signifies that range of trading is narrowed or consolidation is happening and there is a probability that range will now expand going forward.
2. Range expansion results in a breakout and trade is taken in the direction of breakout. Breakout means when any candle after inside candle pattern breaks the high or low of inside bar.
There are two indicators which we will use in this strategy . First is VWAP for which you can simply put volume weighted average price on tradingview and second is “Inside bar by cma”. I am not discussing the Inside bar by cma settings again as we have already discussed it in “Inside Bar scalping strategy”.
VWAP Inside Bar Candlestick Strategy
Entry Rule ( Long )
Step 1: Prices should be above VWAP ( This means market sentiments should be bullish to take long trade )
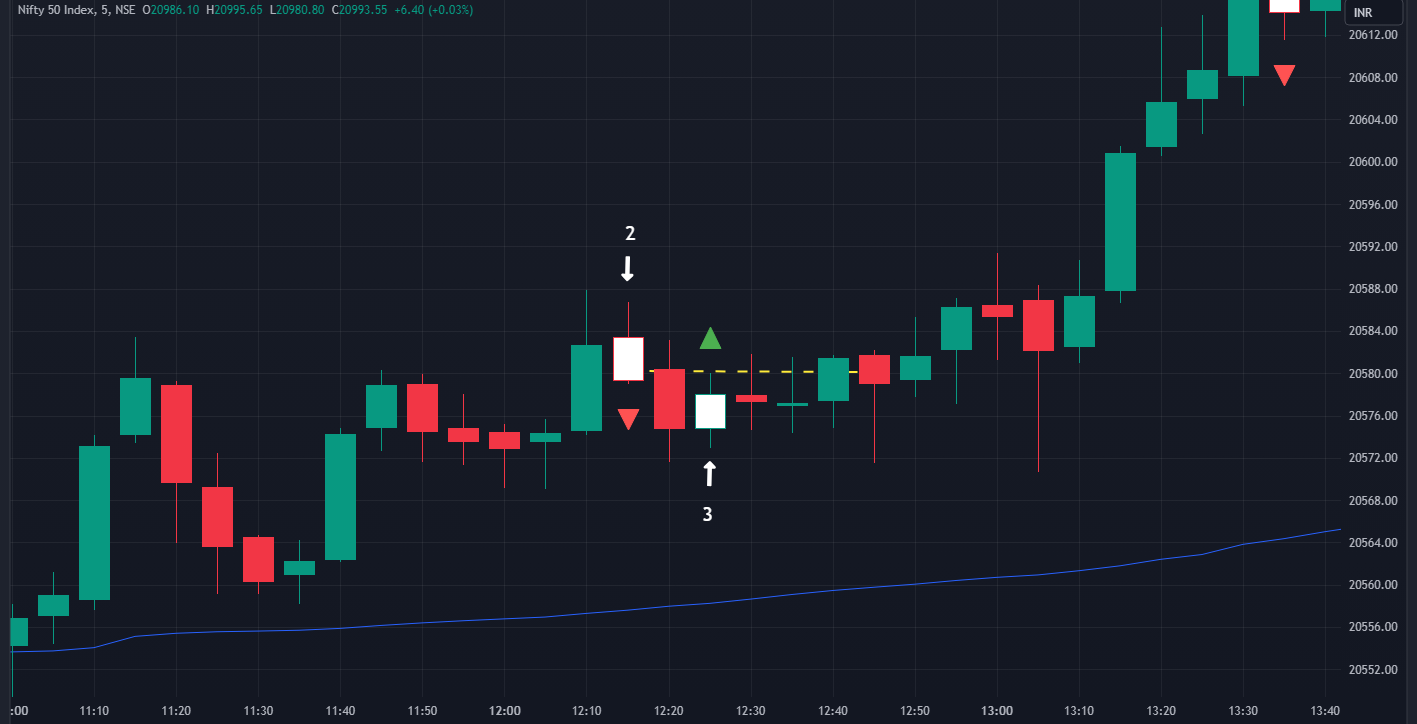
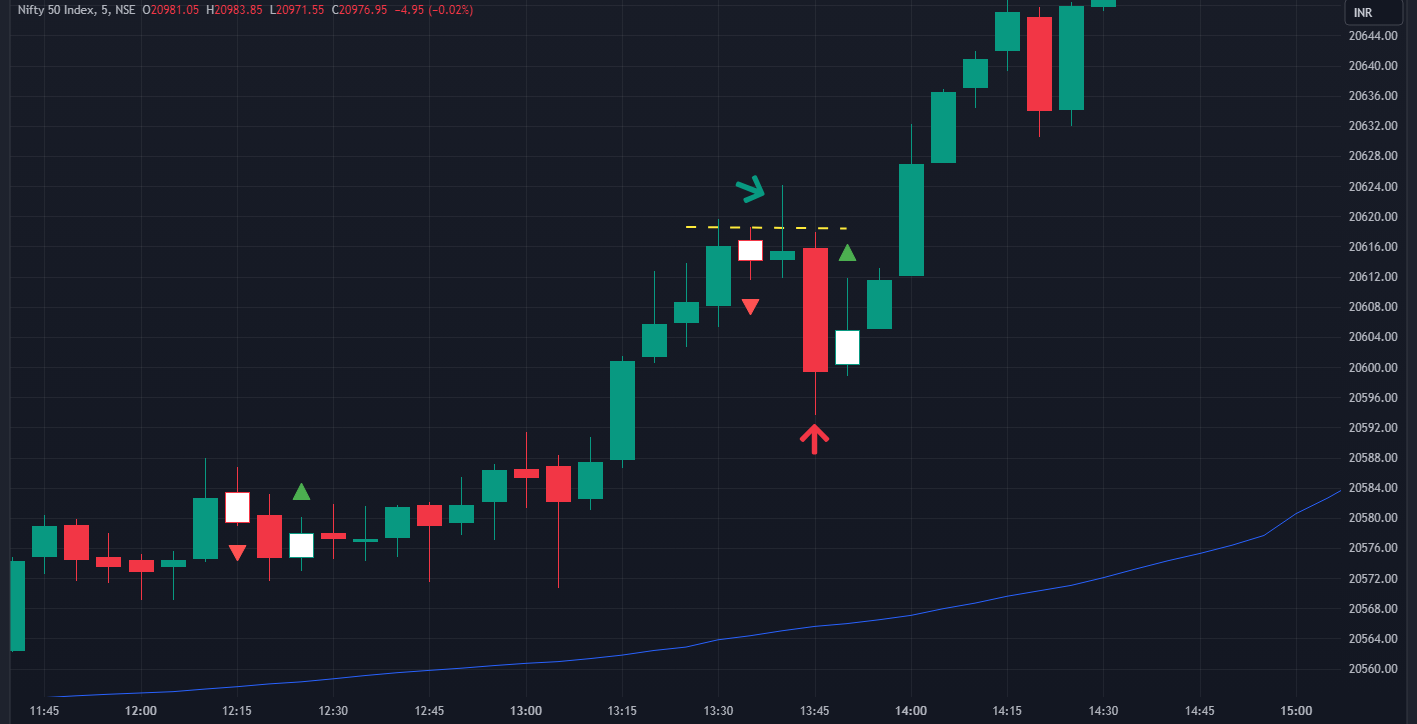
Step 2: Wait for Inside bar candle to form on candlesticks chart. Inside bar candle should be above VWAP line and not ON the VWAP line. If Inside bar candle is more than 25 points then leave this inside bar candle and wait for next Inside bar pattern.

Step 3: If we have identified Inside bar in step 2 , then mark the high of Inside bar .(Because we are looking for a Bullish trade)
Step 4: Take the trade once inside bar candle high is broken by a Green candle

Stop loss
Stop loss will be the low of the inside candle. If inside bar range is less than 8 points , then keep it around 10-12 points on spot chart ( This means around 5/6 Rs in ATM option call )
Exit rule
We will exit after we get 14-16 points on spot chart. ( This means around 8-10 Rs in ATM strike )
* Basis entry , risk reward ratio for this setup is slightly greater than 1 . We have risk of around 250 Rs in a 1 lot trade if we keep stop loss of around 10-12 points on spot chart

Entry Rule ( Short )
Step 1: Prices should be below VWAP ( This means market sentiments are Bearish )
Step 2: Wait for Inside bar candle to form on candlesticks chart. Inside bar candle should be below VWAP line and not ON the VWAP line. If Inside bar candle is more than 25 points then leave this inside bar candle and wait for next Inside bar pattern.
Step 3: If we have identified Inside bar in step 2 , then mark the low of Inside bar . (Because we are looking for a Bearish trade)
Step 4: Take the trade once inside bar candle low is broken by a Red candle

Stop loss
Stop loss will be high of the inside candle. If inside bar range is less than 8 points , then keep it around 10-12 points on spot chart ( This means around 5/6 Rs in ATM option call )
Exit rule
We will exit after we get 14-16 points on spot chart. ( This means around 8-10 Rs in ATM strike )
* Basis entry , risk reward ratio for this setup is slightly greater than 1 . We have risk of around 250 Rs in a 1 lot trade if we keep stop loss of around 10-12 points on spot chart
When NOT to consider Inside Bar ( Very Important )
- As already discussed, we will not consider Inside bar if its range ( High – low ) is more than 25 points.
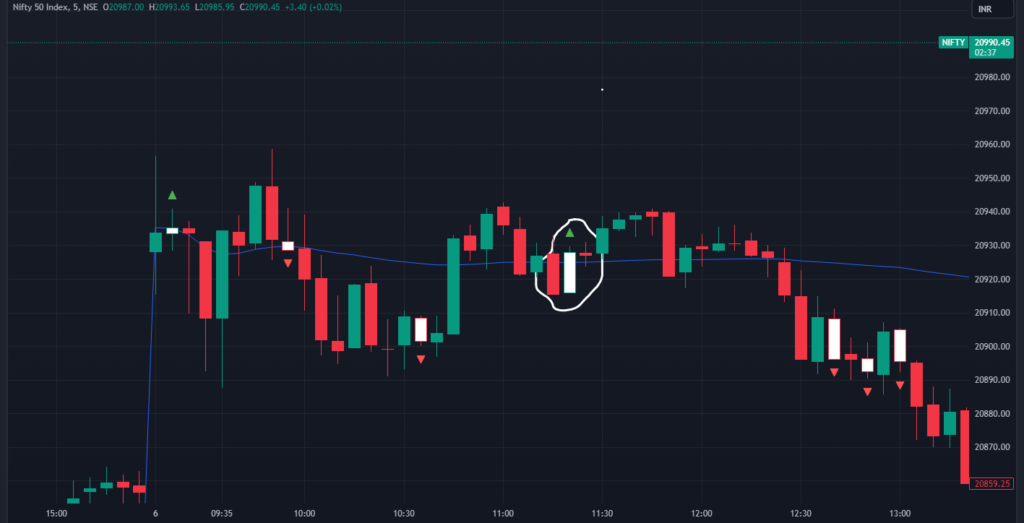
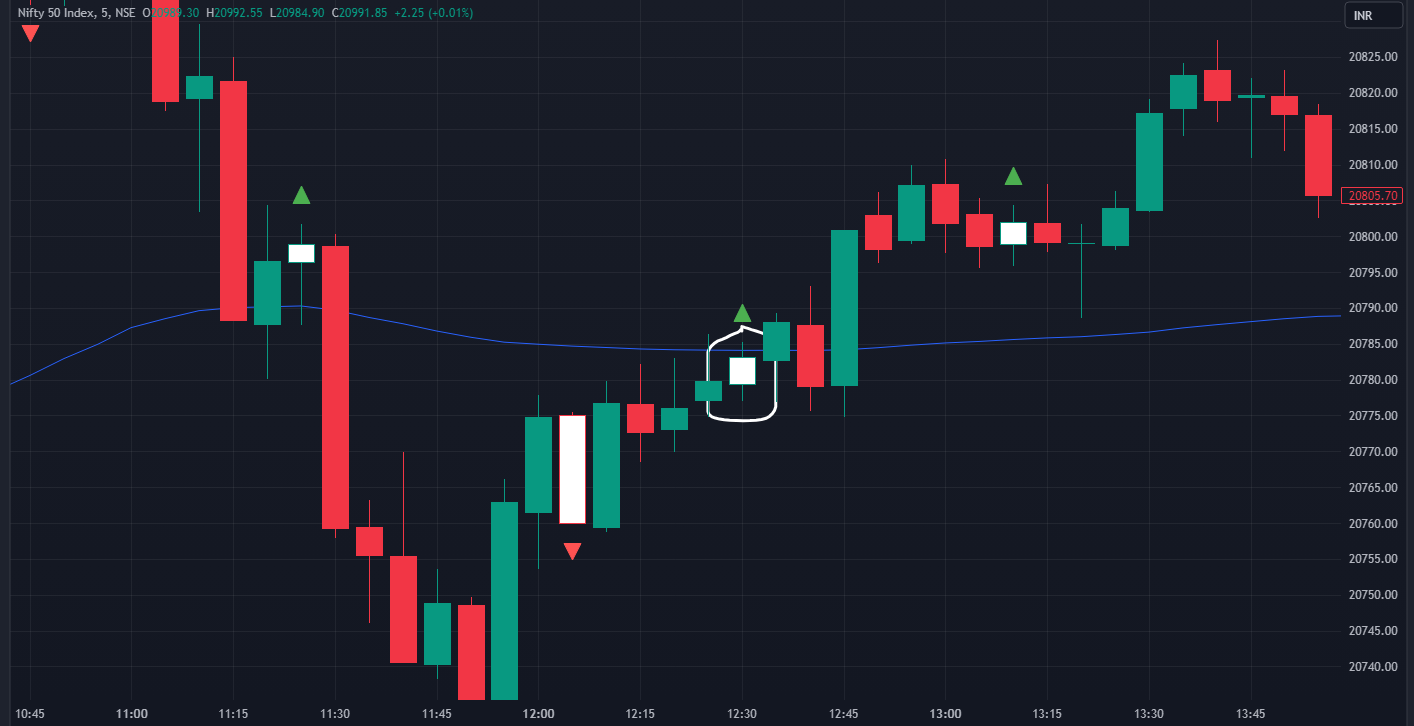
- Suppose in a Bullish setup ( When prices are above VWAP ) , inside bar candlestick pattern is formed. If prices are moved below VWAP , then we will not consider that inside bar and wait for this pattern to form again
- Suppose in a Bearish setup ( When prices are below VWAP ) , inside bar candlestick pattern is formed. If prices are moved above VWAP , then we will not consider that inside bar and wait for this pattern to form again.(Check the graph below for complete understanding)

Other Important points to Remember in this Setup
- Avoid trading before 9:30 am ( Don’t trade for first 15 mins and let market settle down ) . You can also leave the first inside bar candle also while planning your trading day
- Avoid the trade if multiple inside bar candles are being formed.
Backtesting
Always backtest the strategy before taking actual trades in market. The strategy should suit your trading style and psychology.
Any opinions, news, research, analyses, prices, or other information contained on this website is provided as general market commentary for educational purpose only and does not constitute investment advice. StocksGully will not accept liability for any loss or damage including, without limitation, to any loss of profit which may arise directly or indirectly from use of or reliance on such information.

