

In this “Intraday trading strategies: No 1”, we will discuss 5 EMA intraday strategy. This you can apply when you expect prices to move down.
Concept
- Prices in 5 min timeframe and 5 ema indicator will almost move closer to each other . This happens because 5 ema will be exponential moving average of last 5 candles and hence it will run close to prices.
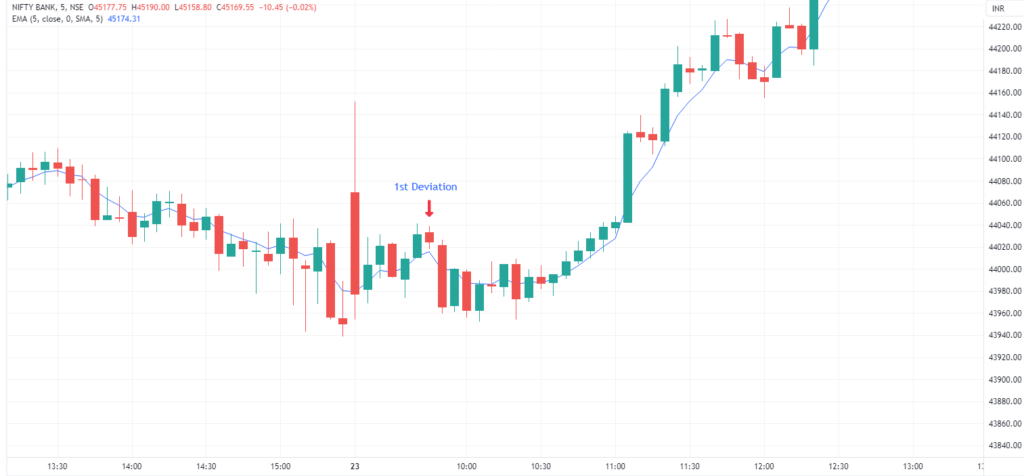
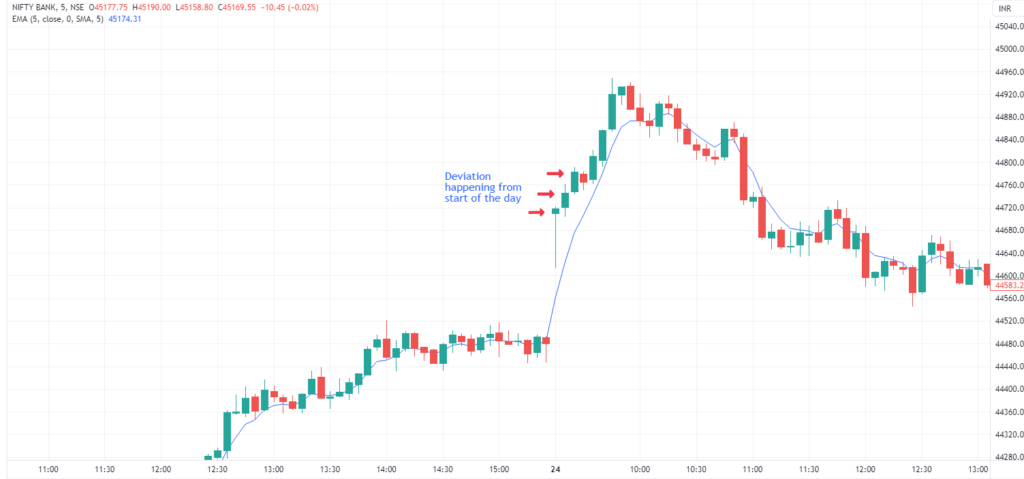
- Now 2 things can happen: Either prices will move away from 5 ema in upward direction or it will move away from 5 EMA in the downward direction. This results into a deviation because prices have moved far away from EMA now.
Note : Because in this strategy we are learning how to take short trade with this setup, so prices should move away from 5 EMA in upward direction.
- As deviation has happened now, so either prices will come back to 5 EMA or 5 EMA will move towards prices. This is where we take the trade
5 EMA Trading Strategy
Entry rule
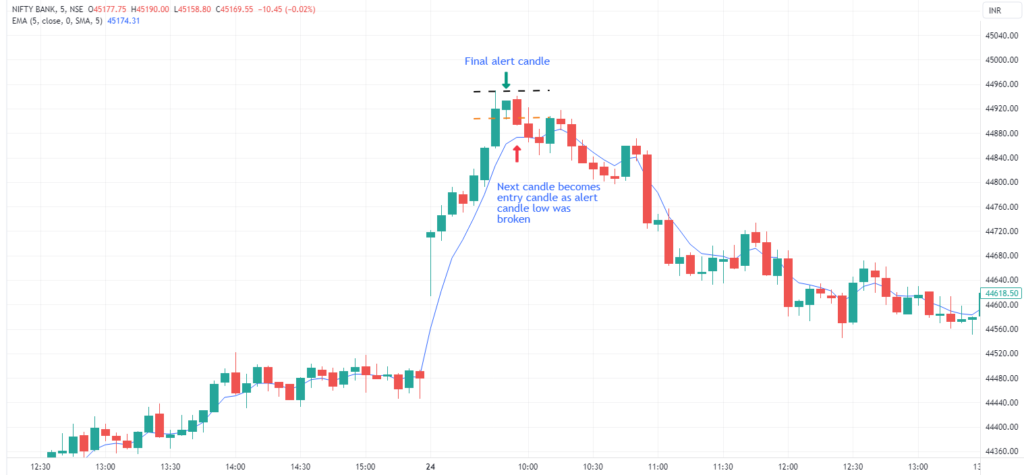
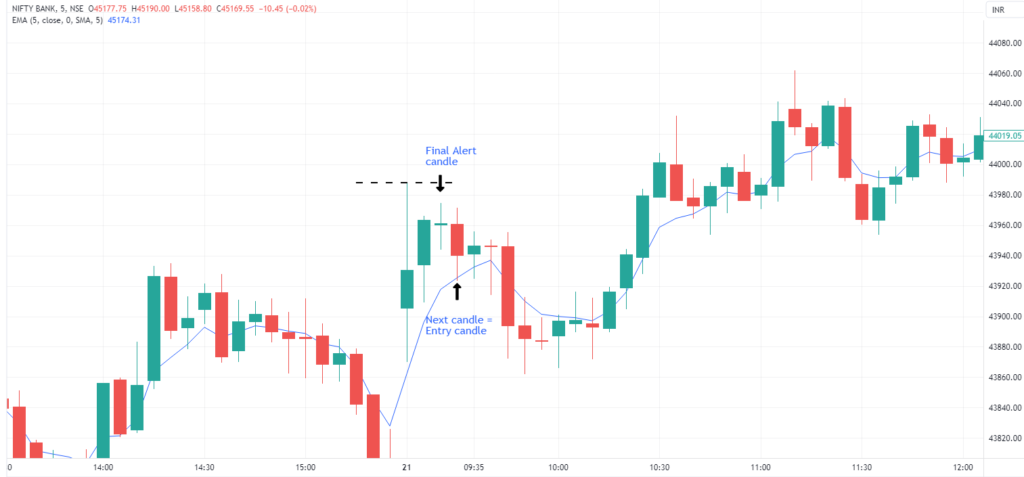
Step 1: First we need to find the alert candle. Any candle which does not touch 5 ema (It can be green or red) is our alert candle. Make sure that low of the candle (Even if it’s a wick) should not touch 5 ema indicator
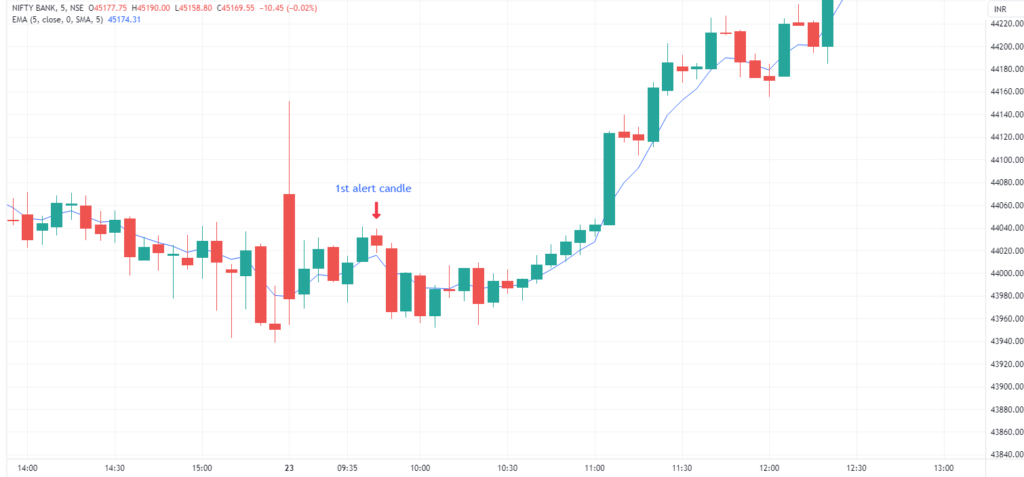
Step 2: Once you find the alert candle (Let’s name this candle “Alert 1”), check how the next candle is formed (Let’s name this candle “Next 1”.)
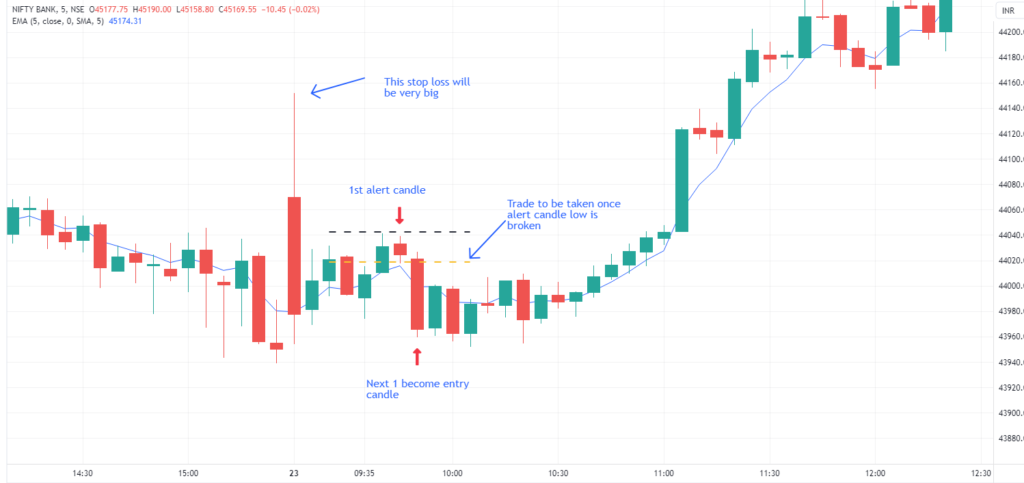
- If next candle (Next 1) breaks the low of alert candle (Alert 1), then it is our entry candle (Next 1 = Entry candle). You can enter the trade when it breaks the low of alert candle( Alert 1 )
- If next candle (Next 1) does not break the alert candle (Alert 1) low, then it means the next candle (Next 1) low is higher than alert candle (Alert 1) low. In this case Next 1 becomes Alert 1. This means that next candle is now the new alert candle. As alert candle is changed, we need to follow Step 2 again
If you go through Step 1 and Step 2 again , after alert candle is formed , Next 1 either become Alert candle or Entry candle .I hope the entry, exit and stop loss is clear to you now . You can comment in case of any question.
Stop Loss
In this strategy stop loss is alert candle high or nearest swing high.
Exit rule
As risk reward is minimum 3, so take exit once you get the risk reward or trail stop loss for higher profits.
Note : Trailing stop loss require expertise in market
Important points to consider basis this setup
- Suppose your SL as per rule is coming around 10Rs in Bank Nifty, then basis Bank Nifty volatility this is a very small stop loss. In this case, check nearest swing high and if SL is coming around 30-40 Rs on that swing high then you can keep that SL.
- Stop loss might hit frequently in this setup.
- Basis this setup you will be able to capture big downward moves. Downward move is always sharp and if captured, will give good profits to intraday trader
- Take only 3 traders as per this setup because risk reward ratio is 3
- Strike price : It should be ATM( At the money )
- This setup works in stocks also but make sure that stock should be liquid enough to take intraday entry and exit
Backtesting
Always backtest the strategy before taking actual trades in market . The strategy should suit your trading style and psychology.
Any opinions, news, research, analyses, prices, or other information contained on this website is provided as general market commentary for educational purpose only and does not constitute investment advice. StocksGully will not accept liability for any loss or damage including, without limitation, to any loss of profit which may arise directly or indirectly from use of or reliance on such information.