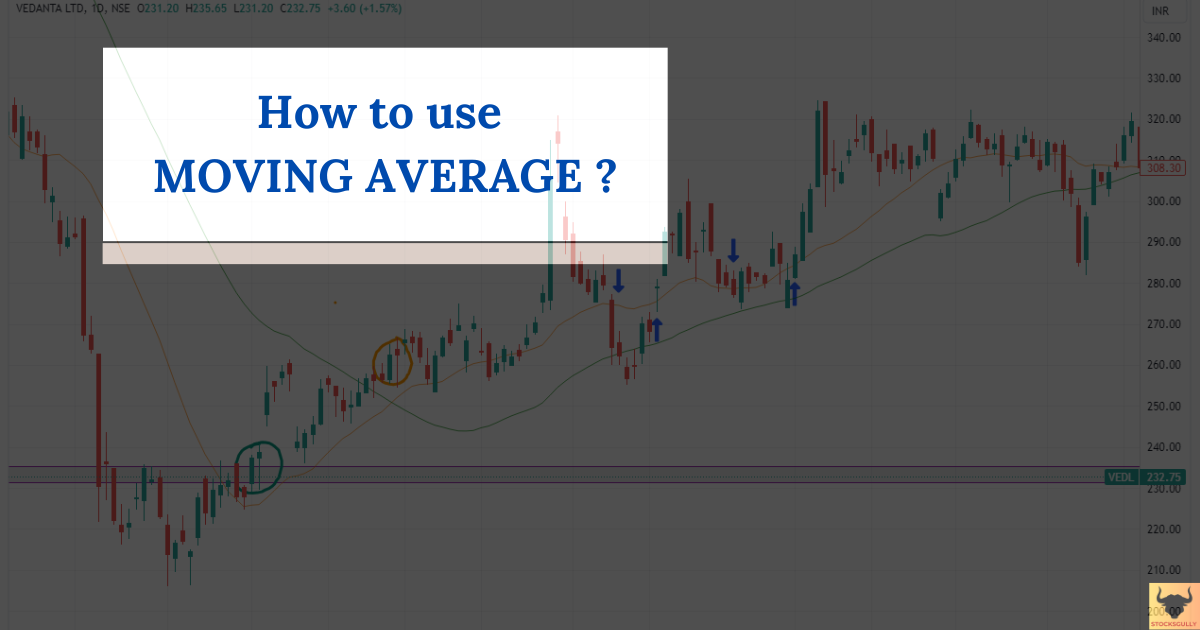
Moving Average is one of the most widely used indicators in technical analysis. A trader can use moving average for intraday or positional/swing trading. This indicator gauge overall market trend and also current sentiments ( Whether the trend is Bullish or Bearish). 
What is MOVING AVERAGE in Trading?
Moving average as the name suggests is an “Average” which is “Moving”. Now when we calculate the average of anything , it is always for a specific period which is chosen by the trader in this indicator.
What is meant by Period of Moving Average?
Period is the duration for which you need an average to be calculated. So if it is 8 SMA ( SMA is Simple moving average) , it means the moving average line will be the average of the last 8 prices and if it is 20 SMA , then it will be the average of the last 20 prices. In most cases closing prices are used for moving average line.
If you are using a daily time frame then 20 SMA will be the average of the last 20 daily closing prices and if you are using a 5 min time frame , then 20 SMA will be the average of the last 20 five minutes (5m) candles . So you can plot moving average line based on the time frame on the chart that you are using.
Lets see Moving Average formula with an example
Suppose you are using a 5 minute time frame on a candlestick chart and also want to plot the moving average line to understand the market sentiments. The table below are closing prices of last 10 candles and we want to plot 5 SMA (Moving Average of last 5 prices)
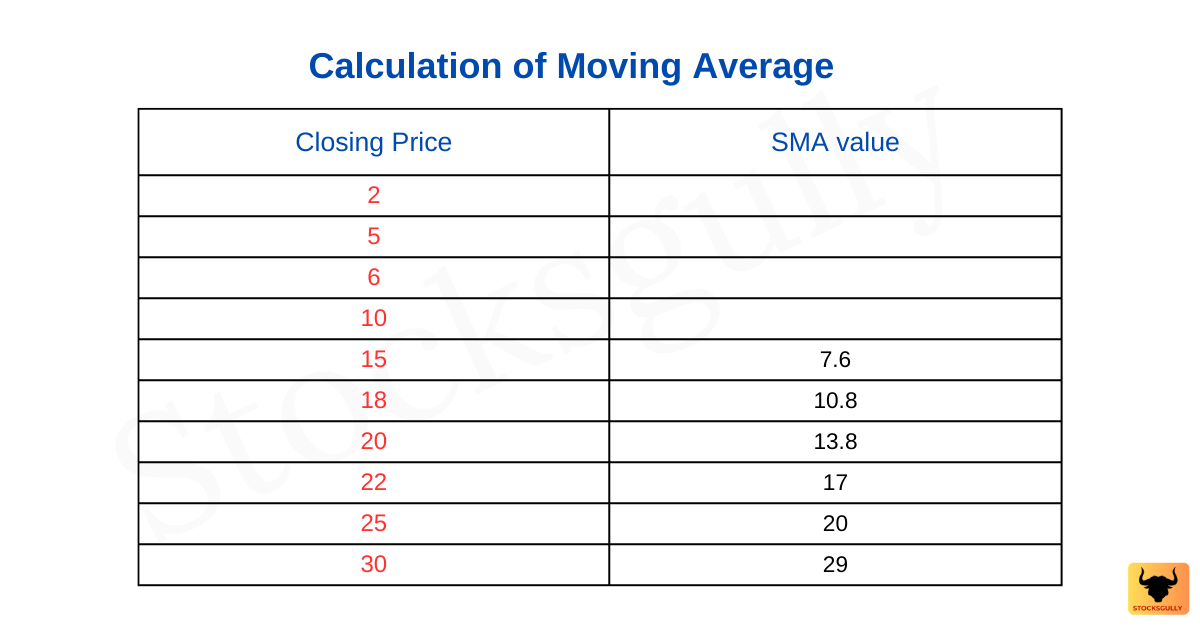
When we connect all SMA values calculated above , it will be like a line ( A moving average line ) which will move upwards because every candle closing price is higher than the previous candle in the example that we have taken . There are 3 things which you should consider here:
- As this indicator is using past closing values of prices only , hence moving average is a Lagging Indicator
- We know that Lagging Indicators don’t predict future price movement but only confirms an ongoing trend and hence Moving Average is a trend following indicator.
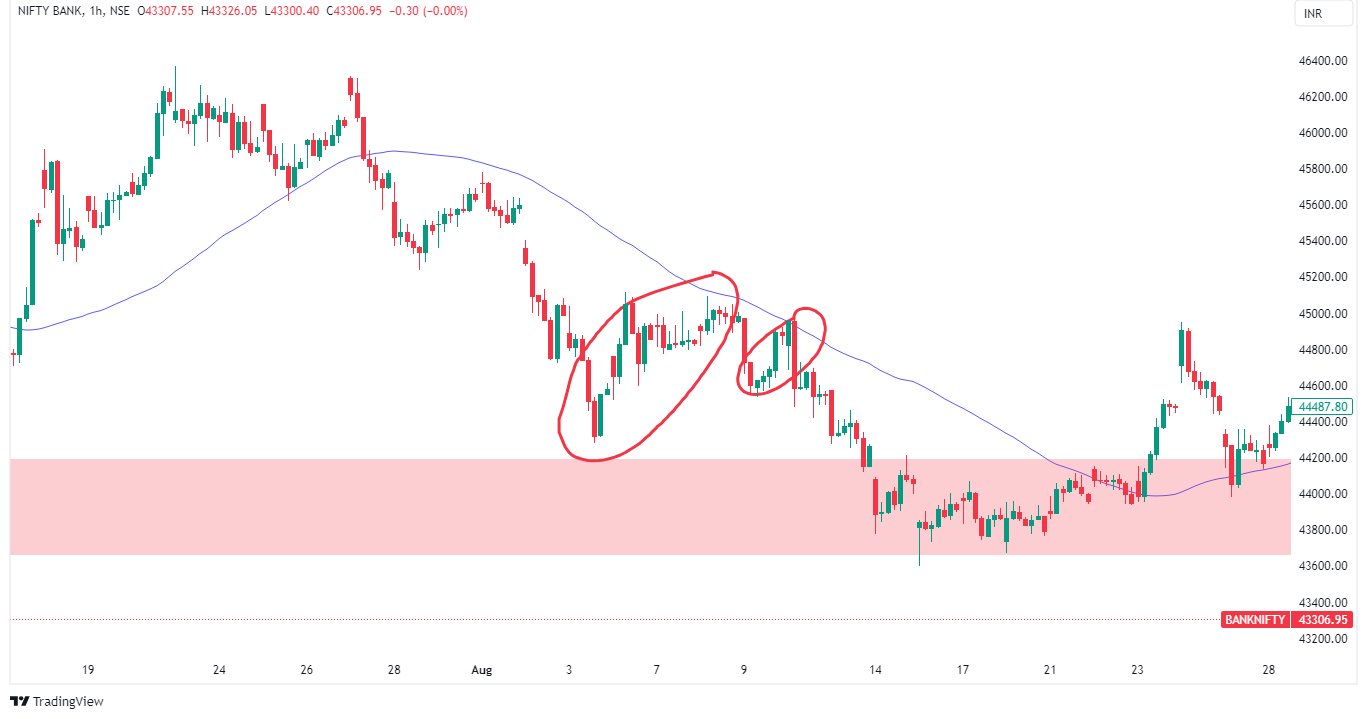
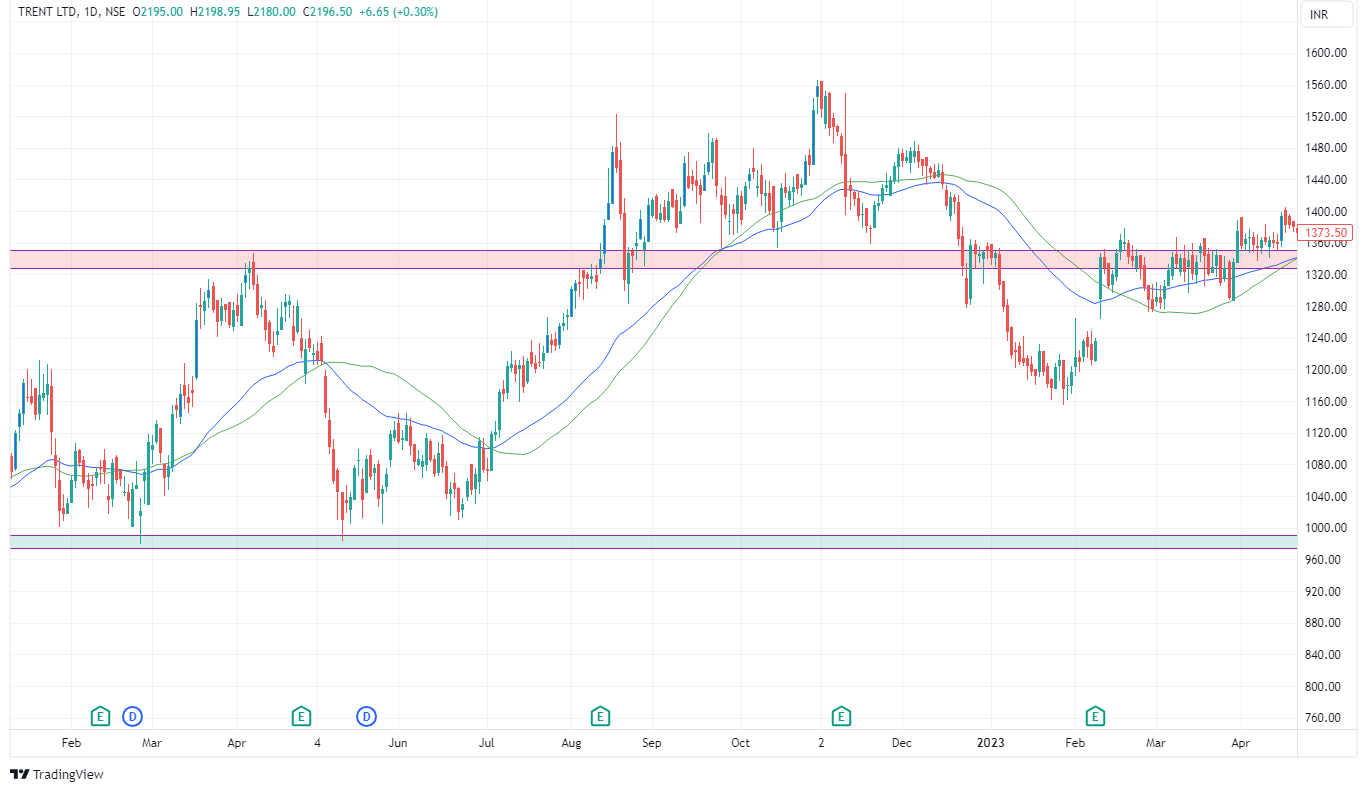
- Moving average smoothens the price data . This means that small fluctuations in the prices are smoothen to provide information to a trader . Lets understand this with the help of a chart.
Why Larger or Smaller period of Moving Average matters to a Trader
Whether you are using Zerodha , Tradingview or any other charting and trading software , Moving Average value can be set by the trader based on his/her choice. Now let’s see how that matters to a trader
Point 1
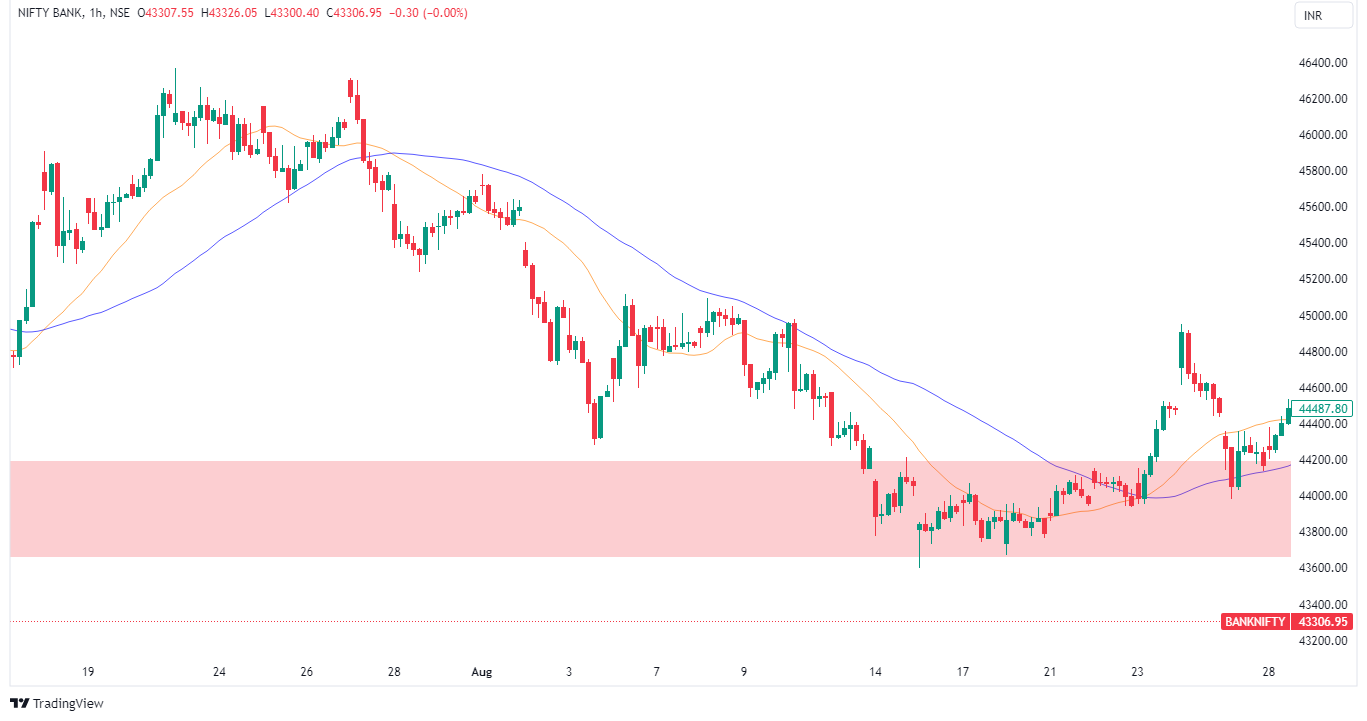
The more the period of moving average indicator, the more will be lag . This means 20 SMA will confirm a trend faster as compared to 50 SMA because lag factor is lesser for 20 SMA . This happens because the 20 SMA line will be the average of the last 20 candles while the 50 SMA will be the average of 50 candles closing prices.
Point 2
MA line with lower period will move closer to prices as compared to MA line with higher period. This means 20 MA will move closely to prices as compared to 50 MA.
Point 3
Lower MA value ( Like 8 MA ) will give more signals to a trader when the prices become Bullish or Bearish as prices will cross the line faster and in the sideways market, moving average is crossed by prices many times .
Short-term moving averages are like hatchback cars , they are fast to change the direction. In contrast, higher value MA ( Like 100 MA ) , takes time to signal an ongoing trend to a trader . You will not find 100 MA crossed by prices very frequently.
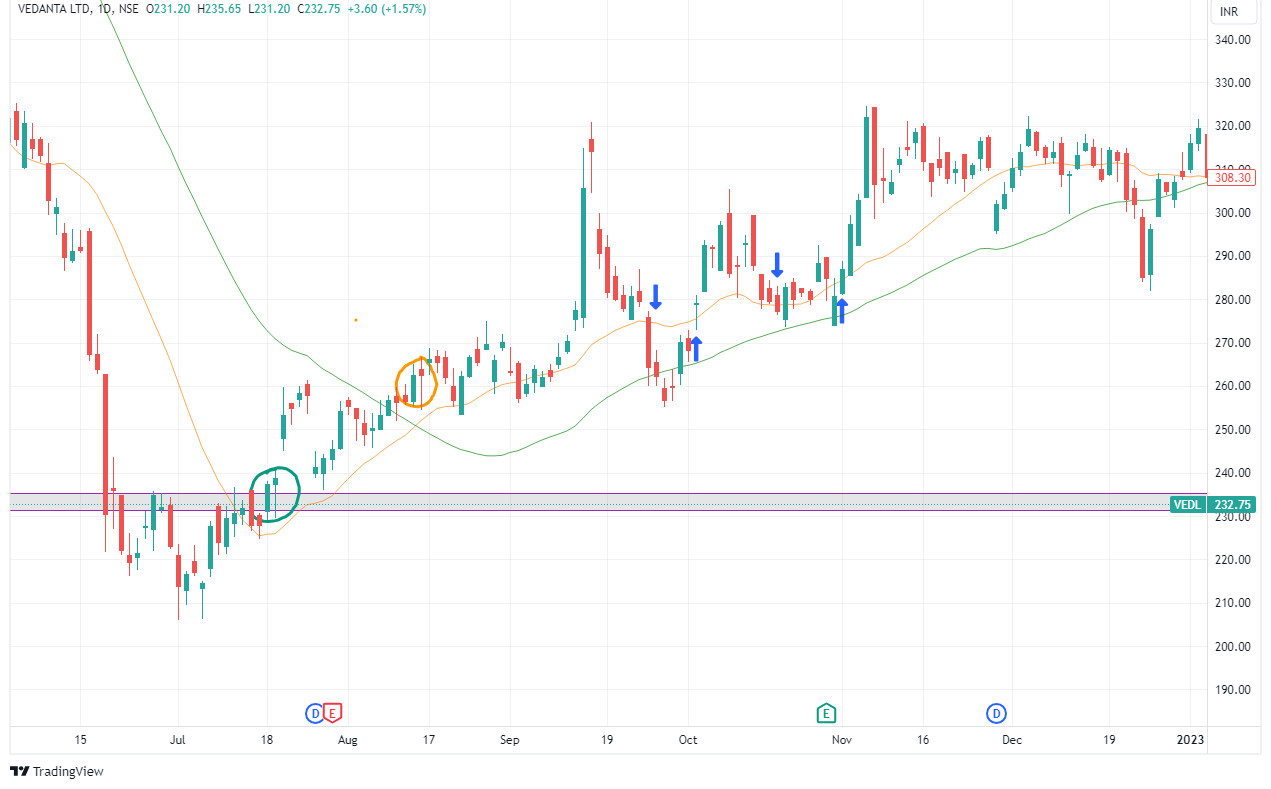
Choosing the right Moving Average period for your Candlestick chart ? Short term or Long term
Should we use a lesser period of moving average for taking the trade early in the trend? No, that’s not entirely true and it depends on your trading setup as well as your time horizon of the trade ( Positional / Swing or Intraday )
Positional/Swing : If you are a positional or swing trader , you will use a higher value of MA ( Like 100 or 200 MA ) because you will not enter and exit stocks frequently . Once prices cross the 200 MA line , this means the market is now bullish as prices have moved above the 200 MA line . We have mentioned in a previous article on how to choose a time frame based on your trading style.
Intraday: An intraday trader might use 5/8/9/20 MA because he wants frequent entry and exit from the trade.
If you are new in trading , it is always beneficial to try different moving averages on different time horizons to understand how it behaves. You can start with 5/8/9/20 period in Moving Average for intraday and 50/100/200 period for positional/swing.
Where we can use Moving Averages:
Trend Identification
One of the most effective and simple ways to use this indicator is to identify the trend and also the market sentiments . If prices have closed above the Moving Average , then it means the market is Bullish and if prices are moving below Moving Average it means market is Bearish. This indicator is used differently by short term and swing/positional traders
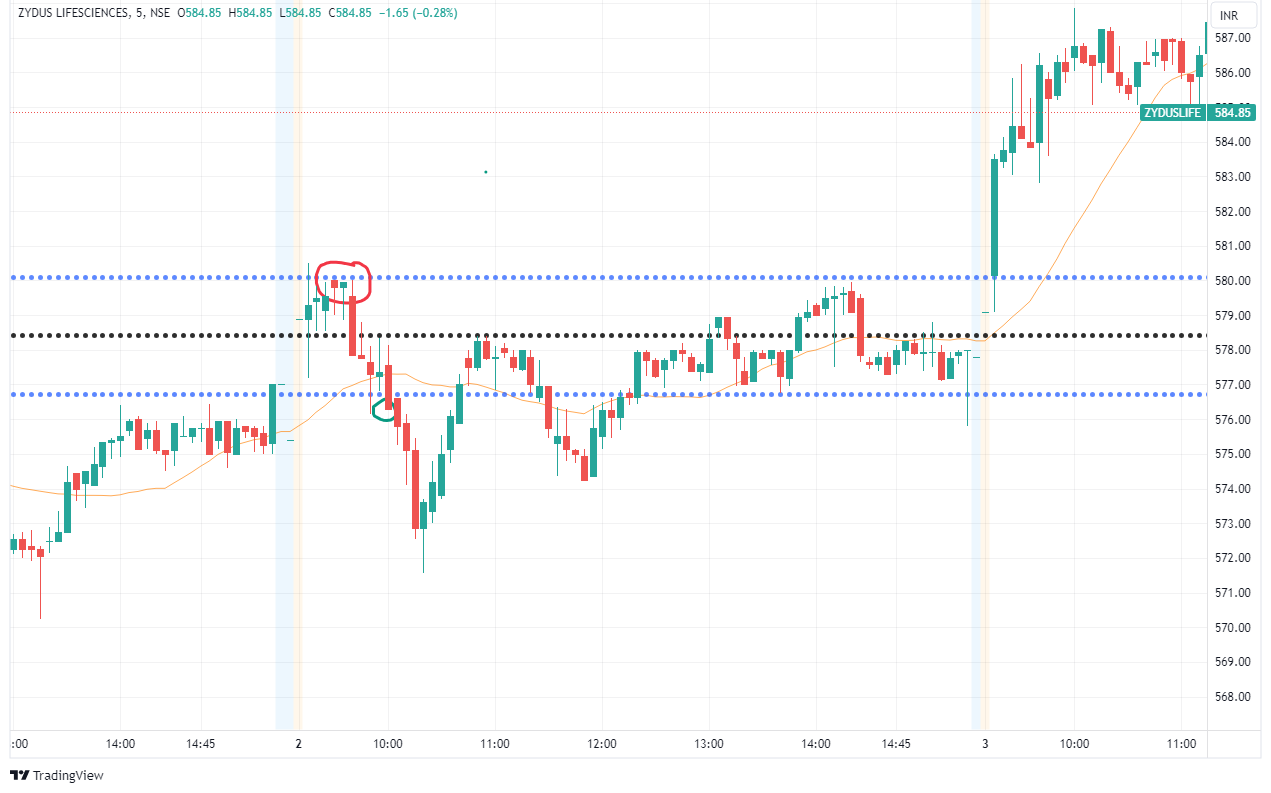
Intraday : As there are too many price fluctuations in a short term time frame ( 1mins / 5 mins etc. ) , traders dont use moving averages alone to enter the trade . They use moving averages along with other indicators or price action techniques. Moving averages are just used for confirmation
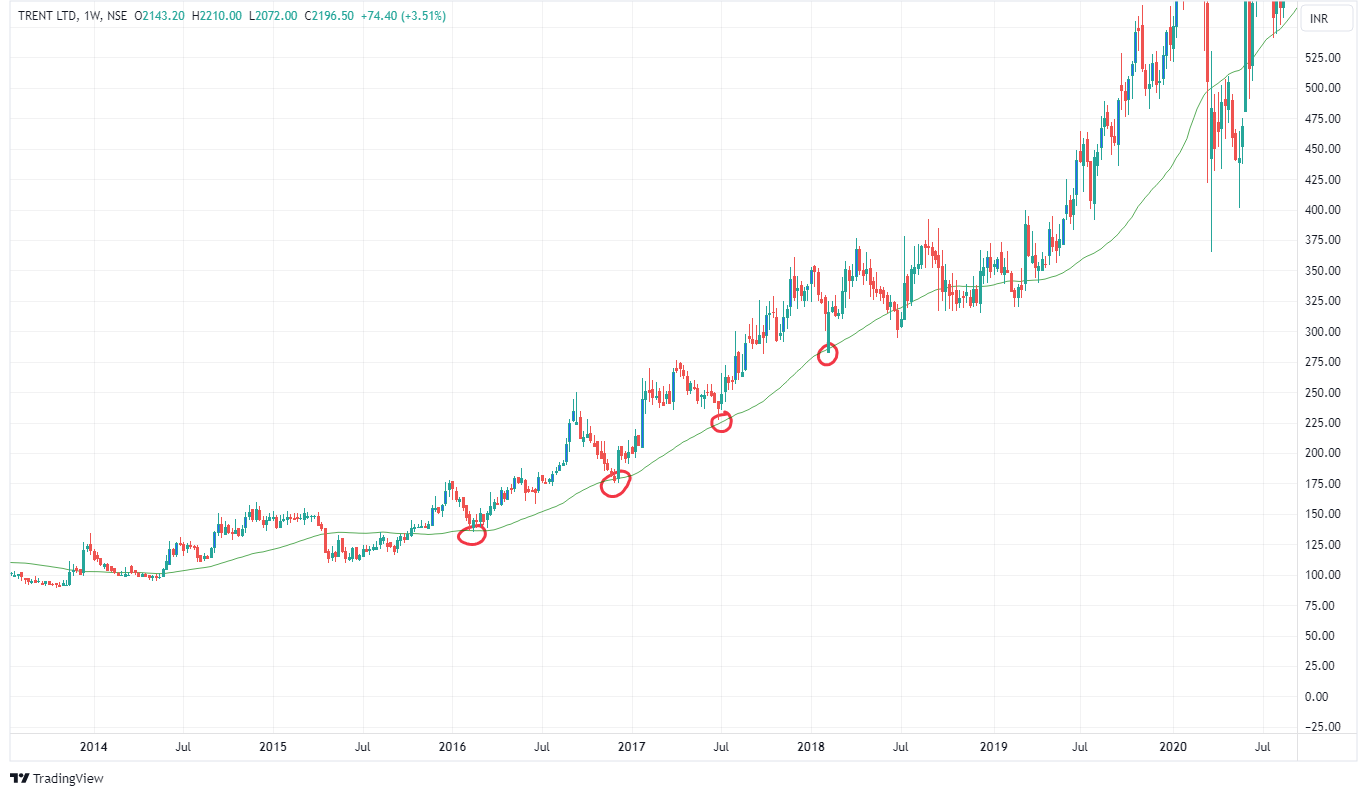
Positional / Swing : Traders use MA to create their market view ( Bullish or Bearish ) . Example : If the price of a stock is above 100/200 MA then the sentiment is bullish and a trader will not make a bearish view on the stock. He will be looking for opportunities to enter long on the stock.
Support and Resistance
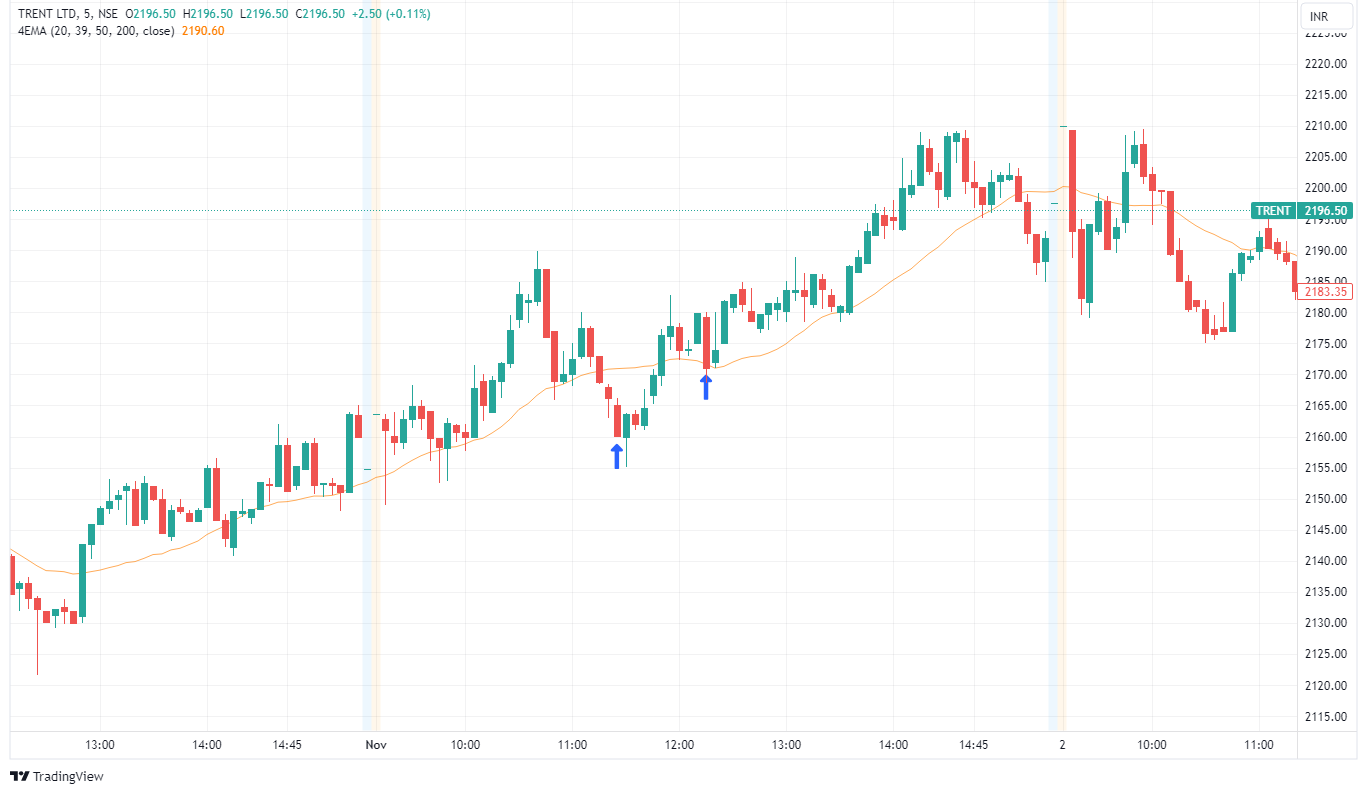
As the name Moving Average suggests , it’s an average which is moving . In an uptrend , the moving average acts as a support and in a downtrend moving average act as a resistance . This is more visible in a larger time frame ( Like 1Day) as compared to a shorter time frame ( 5/15 mins etc.) because shorter time frame have more noise ( Frequent price fluctuations )
Types of Moving Averages
While there are multiple types of moving averages but from the practicality purpose we will discuss only two – Simple moving average and Exponential moving average .
To understand the concept of moving average , we have already discussed how to calculate Simple moving average in the beginning of this article. These indicators are there on every charting platform and there is no need to calculate it manually .
Exponential Moving Average:
Exponential moving averages give more weightage to recent prices. What does this mean ?
If prices have recently moved faster , then EMA will be closer to prices as compared to SMA. This happens because EMA will give more weightage to current prices and will react quickly to change in trend and market sentiments. It depends on trader setup and he can choose either SMA or EMA to trade.
* You can also call Exponential moving average as Weighted moving average because it gives more weightage to recent prices to calculate the average values.
Key Takeaways
- A Trader can use Moving Average for Intraday as well as Positional trades.
- Moving Average is a lagging indicator which use prices for calculating the values . It is used to confirm an ongoing trend rather than predicting the future price movements and also smoothens the price data
- A trader choose higher or lower value of moving average period basis the type of setup and trading style ( Intraday/Swing/Positional)
- In sideways market , lower value of moving average can give lot of false signals to a trader as prices cross the MA line multiple number of times.
- More importantly in shorter timeframe , trader don’t use moving average alone to enter the trade. They use it with other indicators or price action techniques to enter the trade and moving average line is used for confirmation.

