One of the best risk rewards come for a trader if he can catch the trend reversals. So, in this article we will understand bullish engulfing pattern which is a reversal candlestick pattern . It can give a very good risk reward ratio, if identified correctly . This article will cover 3 major topics
- What is bullish engulfing pattern?
- How to spot this pattern on chart and what it means?
- How to take high probability trades using this pattern?
Type of candlestick pattern: Reversal candlestick pattern
No of candlestick pattern: 2 candlestick pattern
What Is a Bullish Engulfing Pattern?
We will understand this pattern assuming we are trading in a daily timeframe. If you do not know what is time frame then read that first as it will not take much time.
Suppose there is a downtrend going on and a day (Let us say it D1) closes with a red candle. On the next day (Let us say it D2) prices opened below the low/closing of the previous day’s red candle but closed above the high/open of the red candle. This means that the candle of day 2 (D2) will be green (As closing price is greater than opening price) and it will engulf the previous day red candle.
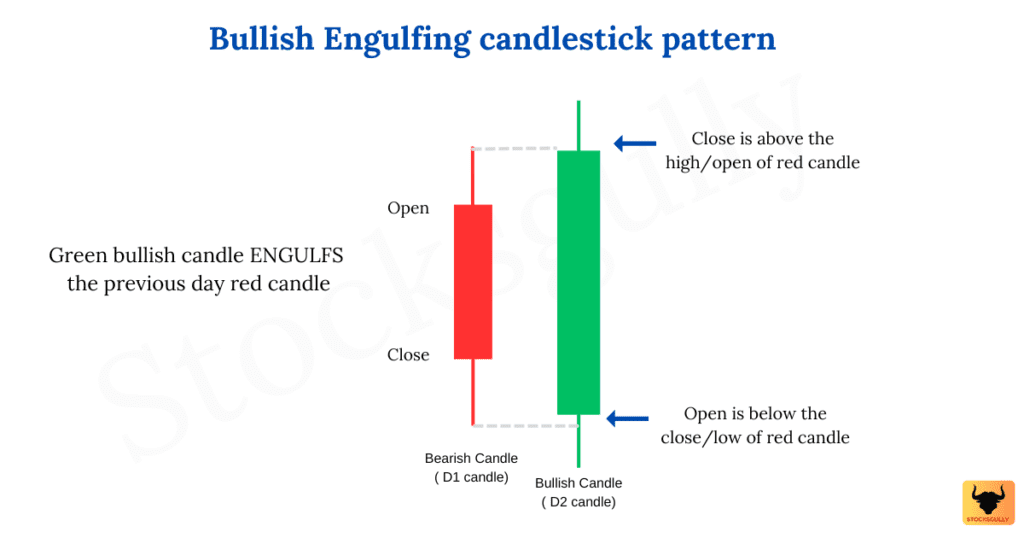
As this candlestick pattern is a reversal pattern which means there should be some previous trend to reverse and in the case of a bullish engulfing pattern, the previous trend should be downward. Once a trader identifies this pattern in the downtrend, they can go long once green engulfing candle is closed as the probability of trend reversal is high.
Understanding the Bullish Engulfing Pattern – Trader Psychology
As this candlestick pattern appears at the bottom of a downtrend, the bullish engulfing candle shows that reversal of a downtrend is likely to happen and indicates that there is buying pressure at that level. As more buyers enter the market and drive prices further higher, this pattern has a higher probability to break the current downtrend.
StocksGully Tip:
The low of green engulfing candle act as a support zone and it is a key level which should be marked by the trader for future price action.
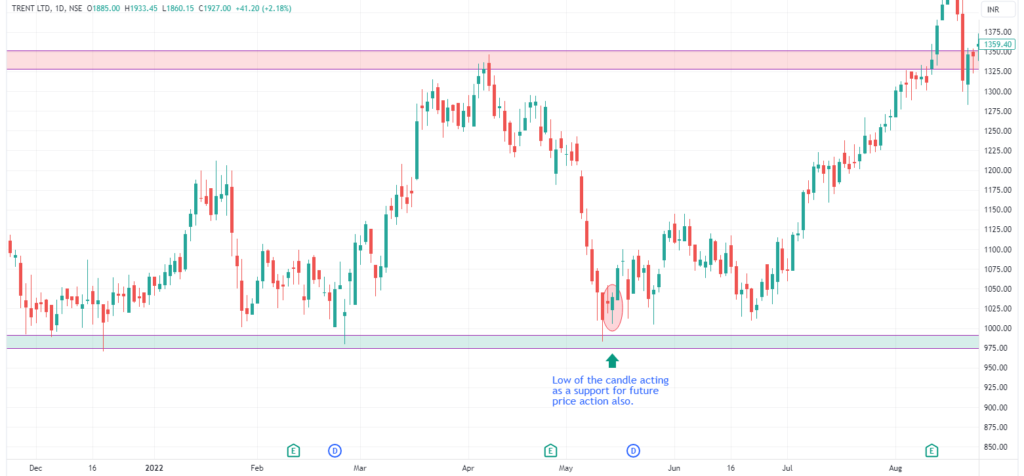
How to spot a good probability bullish engulfing pattern on the candlestick chart?
- First mark support and resistance zone on the candlestick chart
- Identify the current trend. It should be downtrend if you want to trade on this pattern
- Now find this “two candlestick patterns” where first candle should be red and second candle should be green. Green candle should engulf the previous red candle with the close of green candle above the high/open of red candle and open of green candle below the low/close of red candle.
- Check whether this candlestick formation is at support zone.
- Stop Loss: Stop loss in bullish engulfing pattern can be kept at green candle low (D2 candle) which engulfs the previous red candle. (D1 candle)
Example of a Bullish Engulfing Pattern
1st Example : Nifty Intraday
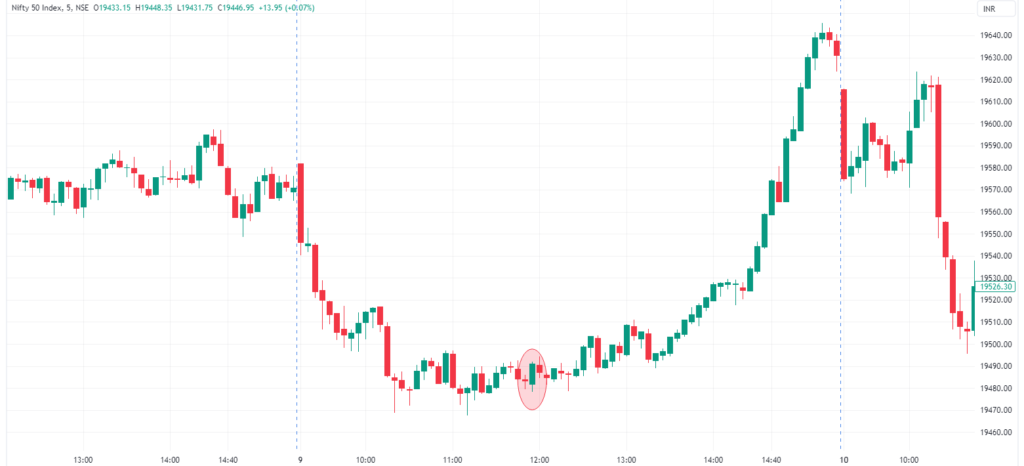
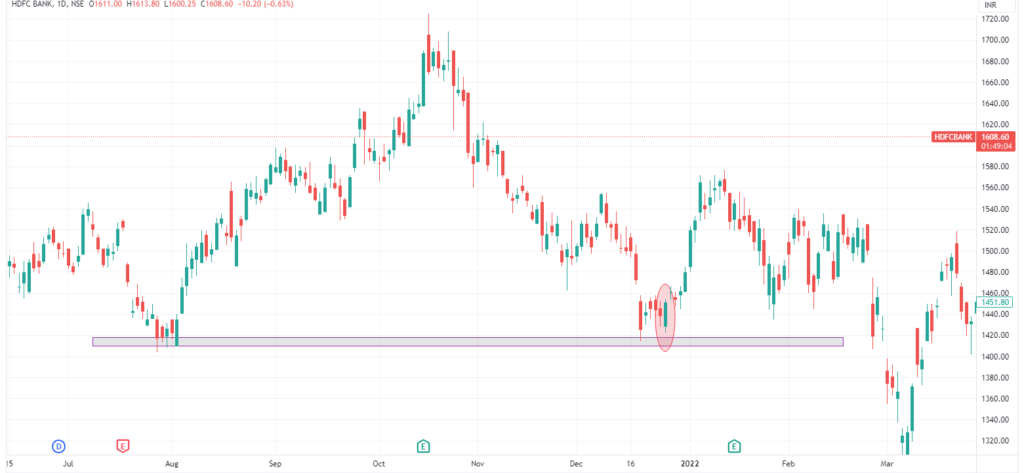
2nd Example : HDFC Bank on daily time frame
How to trade Bullish Engulfing Pattern
Now we know that the bullish engulfing pattern is powerful when it is formed in the downtrend and probability of reversal after this candlestick pattern is high but there are few scenarios that a trader should consider:
- The length of green engulfing candle is very large: Suppose you are taking a trade in Bank nifty where the length of green candle (D2 candle which engulf D1 red candle) is 100 points on spot chart. Let’s assume you are taking at the money (ATM) call then, it’s a risk of around 50 Rs / lot and as per trader’s risk capacity he can decide to go for this trade or wait for a better entry. So always consider the risk if the engulfing candle is too large.
- The location is not supporting reversal: In trading we should look for a high probability or “A category trades” where most of the things are in our favour. Suppose you are taking a trade with this patten which is not at a particular support zone , then reversal might fail. So, it is not a high probability trade here and you can wait for another entry.
- The candle formation is not perfect: This scenario will happen when D2 candle low is not below the previous red candle but may be at the same level or slightly higher. This can also be considered as the engulfing candle and it depends on the experience of the trader if he/she initiates the trade.
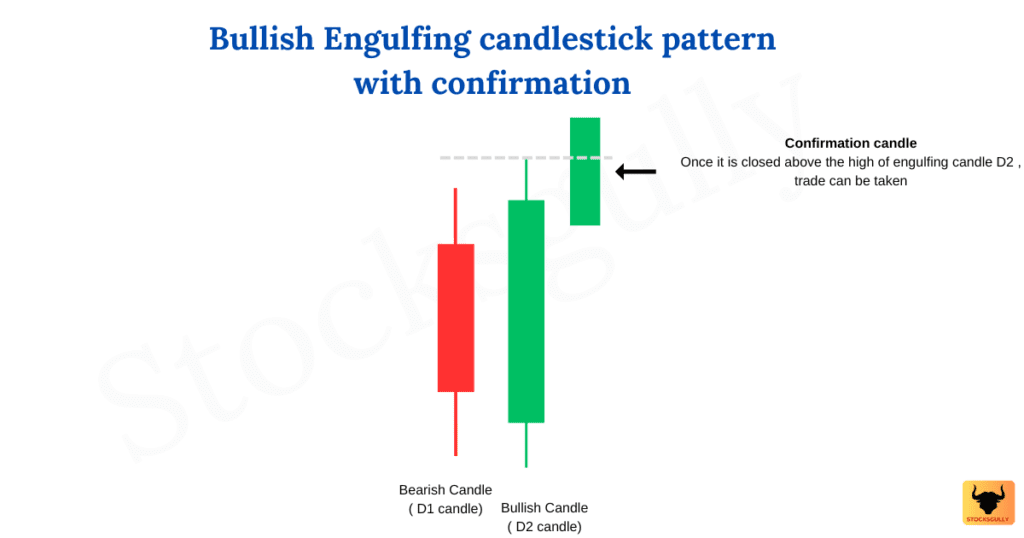
- Waiting for confirmation candle: You can also wait for entry on the confirmation candle which means if the next candle after the green engulfing candle (The third candle which forms just after this pattern is formed) crosses above the second green candle high. This entry style depends on risk that trader can take
- If the day 1 candle is Doji: If the candle which is formed on Day 1 is Doji (Color does not matter but if it is red then better), the probability of the reversal increases after this pattern. This happens because Doji candle is an indecision candle and it means that after downtrend there is a balance between bulls and bears . The day 2 green engulfing candle is a signal that bulls have taken control now.
Key takeaways and points to remember
- The bullish engulfing pattern is a two-candle pattern where 2nd candle (Green color) engulfs the previous candle (red candle)
- It is a reversal pattern which is more powerful when the current trend is downward.
- As the entry is at engulfing candle with low of candle as stop loss, it can give a good risk reward ratio
- Always calculate the risk reward before taking a trade.
- If the location of the candle is also favourable, then it becomes a high probable trade
FAQ’s
-
When to use the bullish engulfing pattern
This pattern has high probability when there is a downtrend (Bears are in power) and then bulls take over indicating buying pressure.
-
How to find bullish engulfing pattern?
There are 3 things which you should look at:
- There is a downtrend going on.
- Suppose a particular day (D1) closes with a red candle or Doji. The next day candle (D2) is green and totally engulfs the previous day red candle indicating buying pressure.
- The pattern success rate increases if it is formed at a support zone
-
How accurate is bullish engulfing pattern?
There is no pattern which has 100% success rate but bullish engulfing pattern is very powerful pattern. When other factors like – “pattern forming at a support zone“ are also there, winning rate for a trader will increase.
You should also backtest this candlestick pattern to understand how accurate it is basis your analysis and trading style. This pattern should develop after a long downturn and not in sideways market for trader to trade effectively.
-
What happens after a bullish pattern?
After this pattern is formed, there is a high probability of trend reversal as market sentiment has changed. It is indicated by bullish green candle
Trend reversal: – It does not always mean that price reversal will happen, it also means that prices might move sideways also from that level.
Any opinions, news, research, analyses, prices, or other information contained on this website is provided as general market commentary for educational purpose only and does not constitute investment advice. StocksGully will not accept liability for any loss or damage including, without limitation, to any loss of profit which may arise directly or indirectly from use of or reliance on such information.

