
In this “Intraday trading strategies: No 7”, we will discuss “VWAP Gap strategy”. This you can apply when you expect prices to move up or down basis indicator and price setup.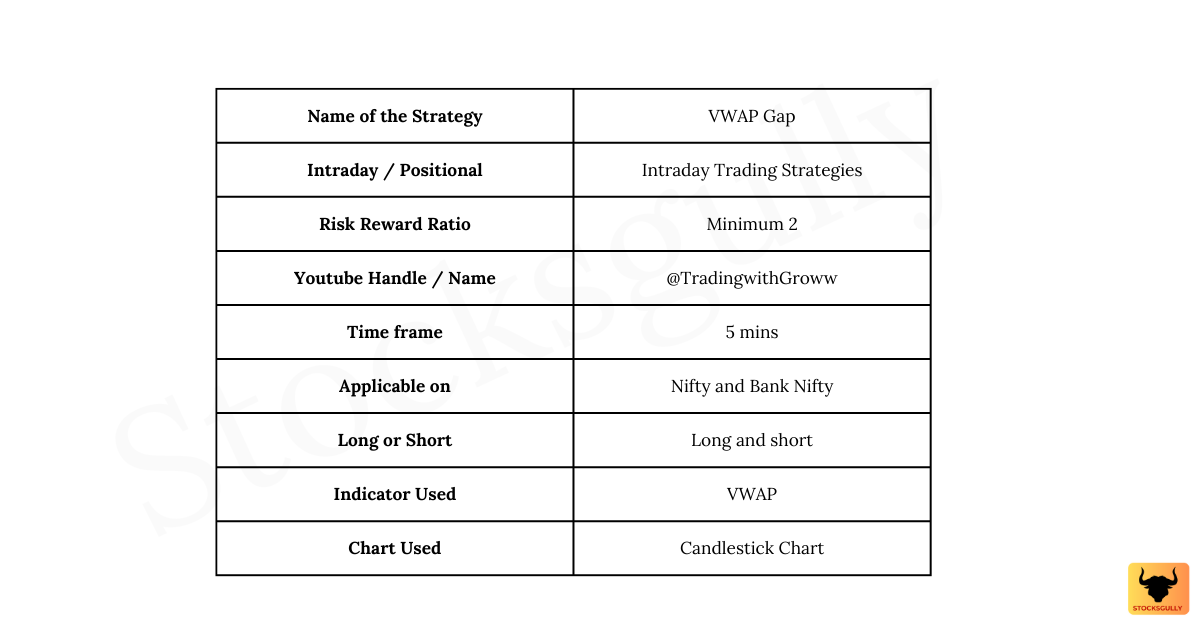
Concept
1.VWAP line is “volume weighted average price” line which includes prices and volume for calculating the average price. This means if prices move up along with rise in volume, the VWAP line will also move up.
2.If prices are above VWAP line, it means market sentiments are Bullish and if prices are below VWAP line then it means sentiments are Bearish
3.If prices cross the VWAP line either from above or below the line , it means market sentiments have changed now and this is where we take the trade in this strategy. This is also called as reversal trade strategy
VWAP Gap Trading Strategy
Entry rule
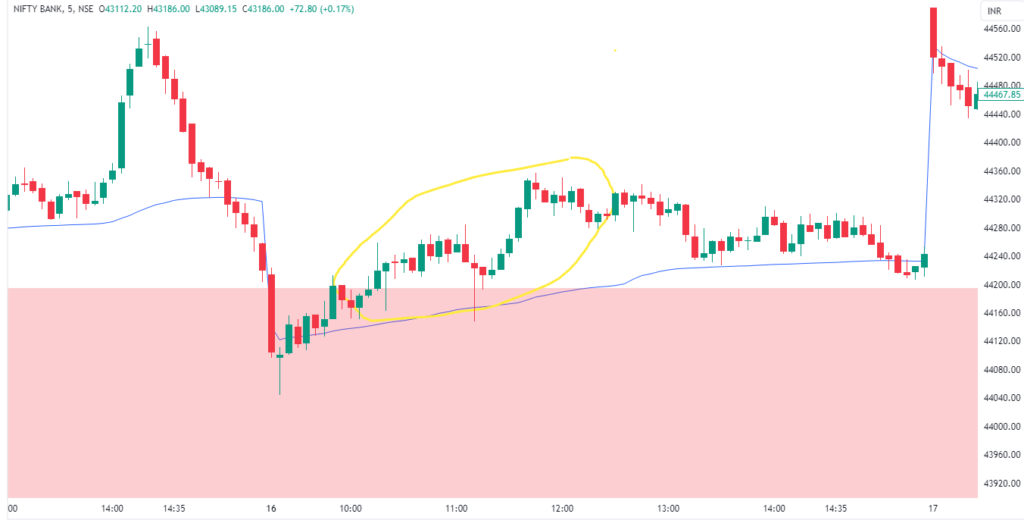
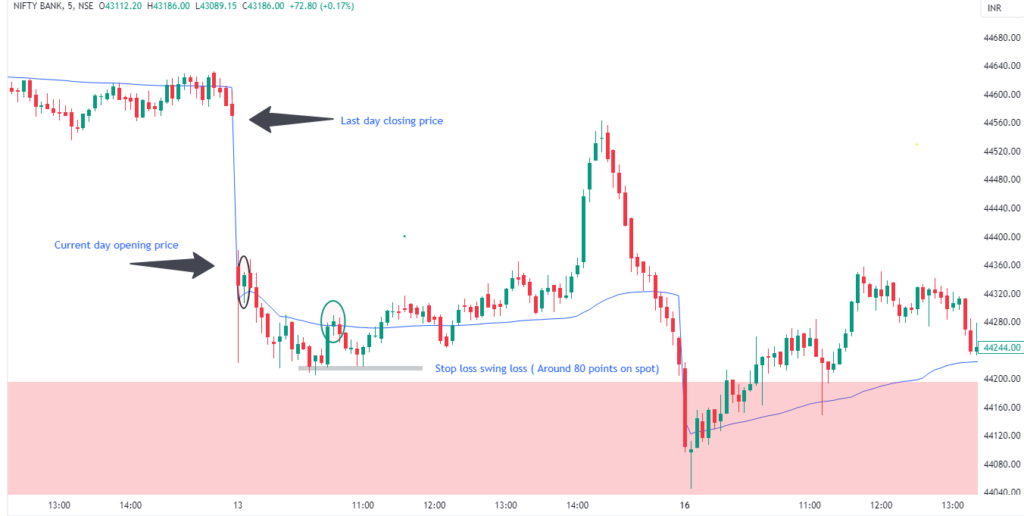
Step 1: First, we need to identify whether there is gap in the first candle or not ( It can be Gap up or Gap down). Gap is the difference between closing price of last day and opening price of current day in 5 mins timeframe.
Gap up: When opening price is HIGHER than last day closing price.
Gap down: When opening price is LOWER than last day closing price
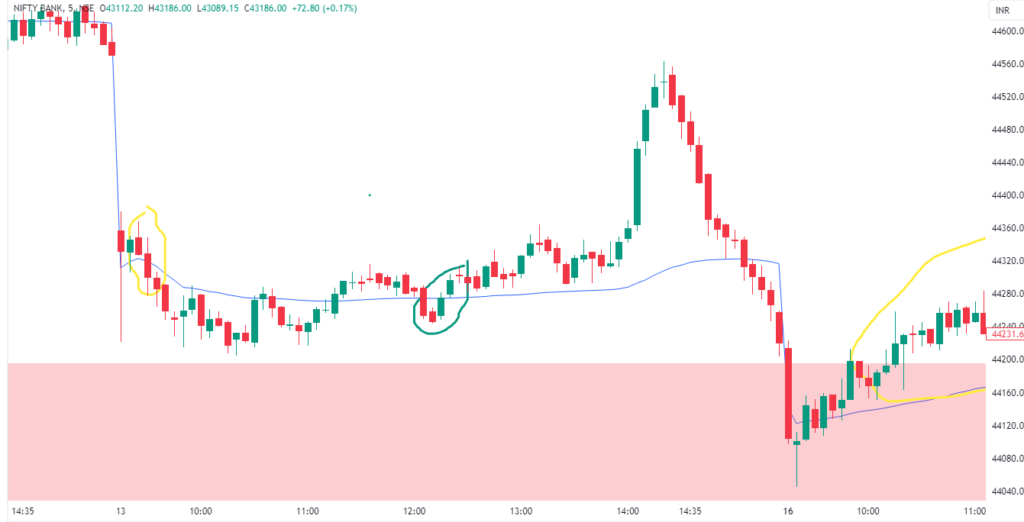
Step 2: We will wait or reversal in prices or change in market sentiments. This means if there is GAP UP then we will wait for opportunity to take trade in the downward direction (Buy PE ). Similarly if there is GAP DOWN , we will wait for opportunity to take the trade in upward direction ( Buy CE).
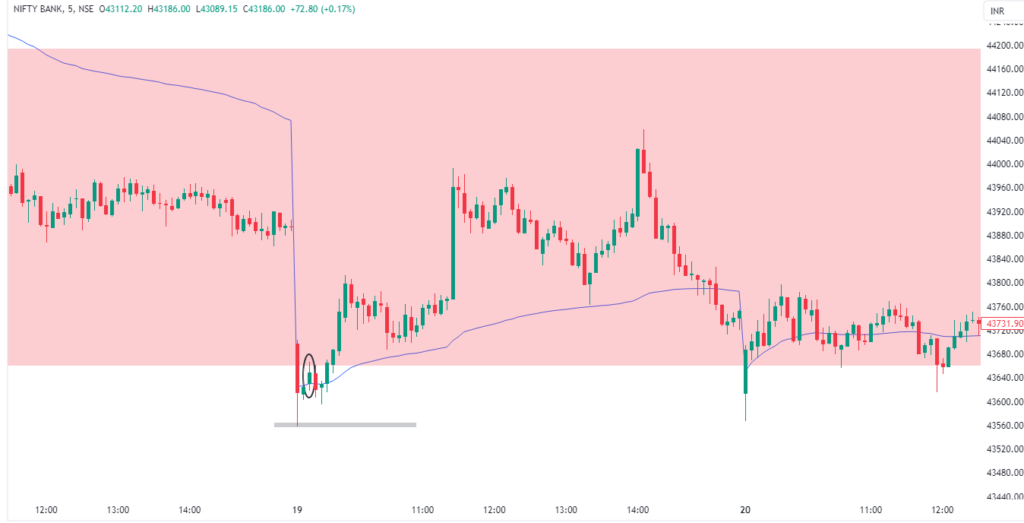
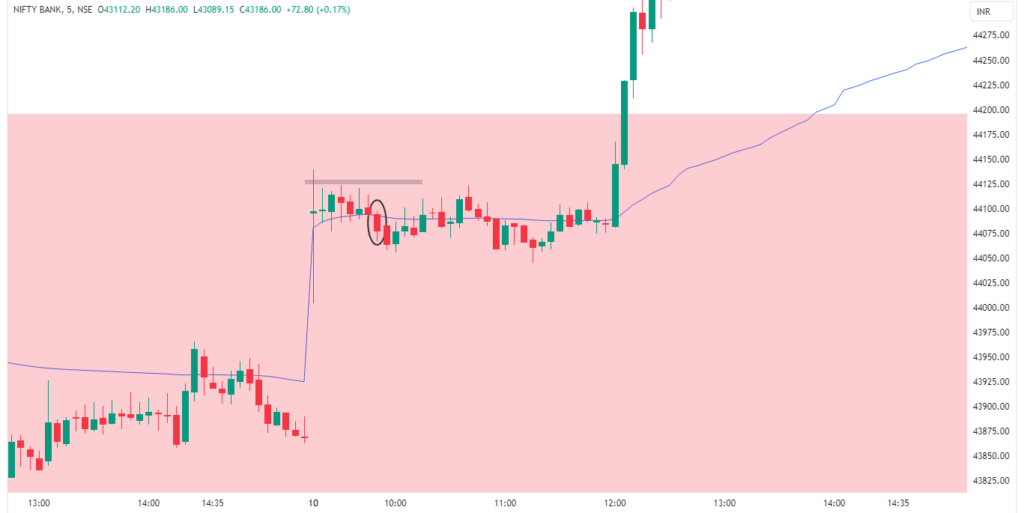
Step 3: If there is GAP UP , then we will wait for prices to close below VWAP line to take the trade .Once candle closes below VWAP line, we will enter the trade in downward direction . Similarly if there is GAP DOWN, we will wait for prices to close above VWAP line to take the trade.
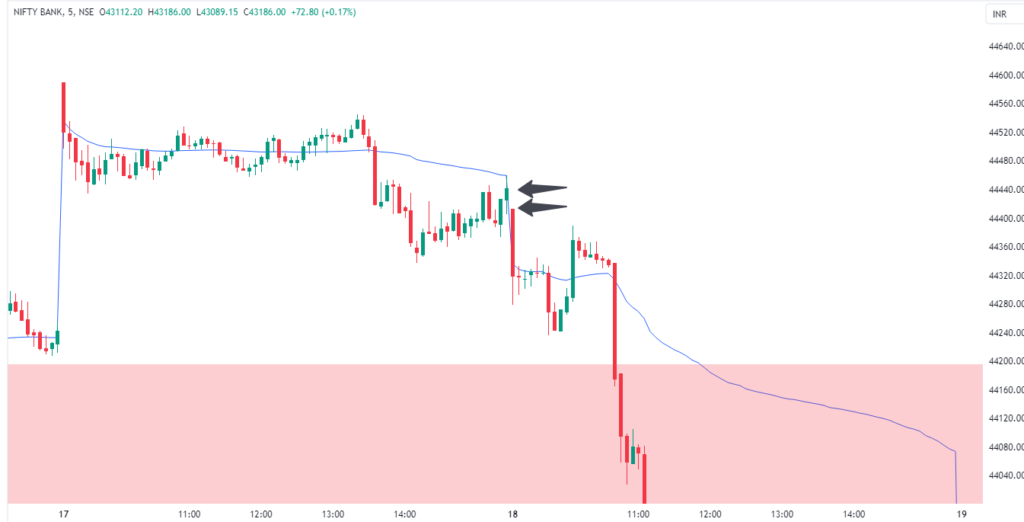
In this strategy we wait for change in market sentiments to enter the trade. If there is GAP UP , it means market sentiments are bullish at the start and in most of these cases ( When there is GAP UP ) price will also close above VWAP line. Now when we wait for prices to close below VWAP , it means market sentiments have change now and we can see a good move in other direction . All the traders who have gone long assuming market is bullish will start booking profit or exit at loss when prices become bearish.
Stop Loss
As per the stop loss mentioned for this strategy , it is 1% of prices but for NIFTY and BANK NIFTY that will be very small. So like in other strategies that we have seen for Bank NIFTY and NIFTY , there are two options which we can backtest or forward test:
- Keep stop loss at swing high / swing low basis direction of the trade.
- Keep stop loss around 15-20Rs for NIFTY and around 40-50 Rs for BANK NIFTY.
Exit Rule
As risk reward is minimum 2, so take exit once you get the risk reward or trail stop loss for higher profits.
Important points to consider basis this setup
- If there is no GAP UP or GAP DOWN in prices, then it is better not to take the trade as per this setup
- If there is a significant GAP UP or GAP DOWN, then chances of this setup to be profitable increases.
- Reversal trade in downward direction gives target faster (This happens because prices moves faster in downward direction)
- VWAP indicator works only to take trades in Intraday.
StocksGully tip:
If you are option buyer , then not only your direction has to be right but also movement should be fast in the direction of your trade for profits. If prices move sideways after entry then SL might hit due to time decay ( Even if direction is correct )
Backtesting
Always backtest the strategy before taking actual trades in market. The strategy should suit your trading style and psychology.
Any opinions, news, research, analyses, prices, or other information contained on this website is provided as general market commentary for educational purpose only and does not constitute investment advice. StocksGully will not accept liability for any loss or damage including, without limitation, to any loss of profit which may arise directly or indirectly from use of or reliance on such information.