
Evening Star pattern is a reversal candlestick pattern which can give a very good risk reward ratio if identified correctly. We will understand 3 things here like we cover in every Bearish Candlesticks patterns
- What is an Evening Star pattern?
- How to spot this pattern on a chart and what it means?
- How to take high probability trades using this pattern?
Type of candlestick pattern: Reversal candlestick pattern
No of candlestick pattern: 3 candles pattern
What Is an Evening Star Pattern?
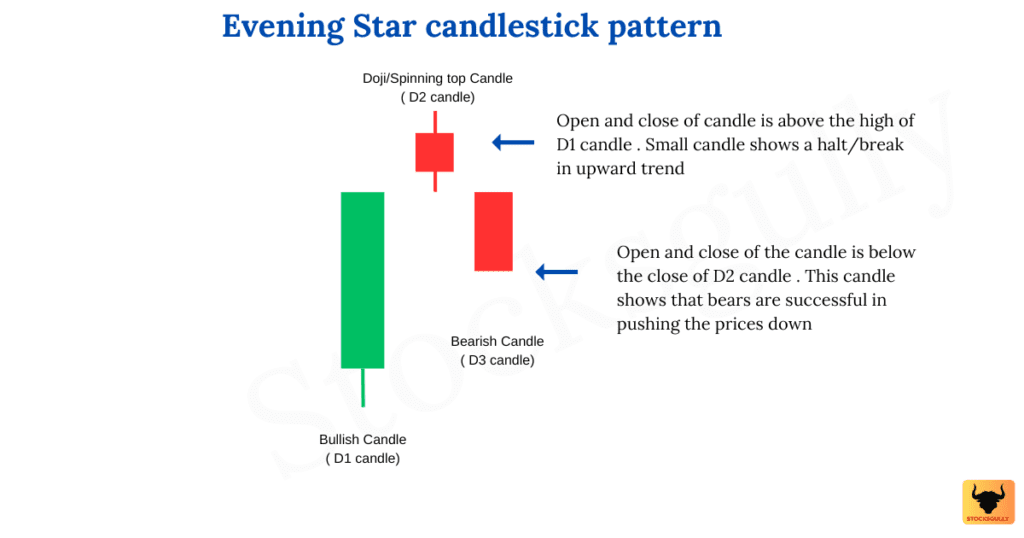
We will understand this pattern assuming we are trading in a daily timeframe. Suppose there is an uptrend going on and a day (Let us say it D1) closes with a Green candle. On the next day (Let us say it D2) there was not so much movement in prices and a small Bearish or Bullish candle was formed ( It can be Green colored or Red colored ). Size of the D2 candle should be small because it indicates neither bulls were very active nor bears. On the third day ( Let us say it D3 ) a bearish candle is formed which closes below the low of D2 candle. If the size of D3 candle is large then its better.
As this candlestick pattern is a reversal pattern which means there should be some previous trend to reverse and in the case of the Evening Star pattern , the previous trend should be upward. Once a trader identifies this pattern in an uptrend, they can go short (after D3 candle is closed as the probability of trend reversal is high.)
What is a Perfect Pattern for Evening star
- D2 candlestick open and close should be Above close of D1 candle ( This means a gap up D2 candle )
- D3 candlestick open and close should be Below close of D2 ( This means a gap down D3 candle )
Understanding the Evening Star pattern – Trader Psychology
As this candlestick pattern appears at the high of an uptrend, the evening star pattern shows that reversal is likely to happen and indicates that bears have started dominating the market. As more sellers enter the market and drive prices lower, this pattern has a higher probability to break the current uptrend.
Lets see what each candle indicates to a Trader
D1 candle: Green bullish candle in an ongoing uptrend
This shows the market sentiment is still bullish as buyers are pushing the prices up and they dont see a reversal yet.
D2 candle: A Doji or a Small candle ( It can be of any color but if its red then better )
This shows that traders are indecisive now . Doji shows a range bound movement or a halt in bullish market sentiment. ( This is like you apply a break to a car moving at a good speed before taking a turn ) . It gives a signal that bears might come in the market to change the direction.
D3 candle: Red candle with a normal or big body
After there is indecisiveness in the market ( Shown by D2 candle ) , D3 candle shows that bears have started dominating the market by pushing the prices down. Now all buyers who have taken position on D1 candle ( because market sentiment were bullish at that time ) will start either selling at a loss or in the fear of incurring a loss by taking small profit. This will push prices further down.
StocksGully Tip
- The high of Evening star candle act as a resistance zone and it is a key level which should be marked by the trader for future price action at that level.
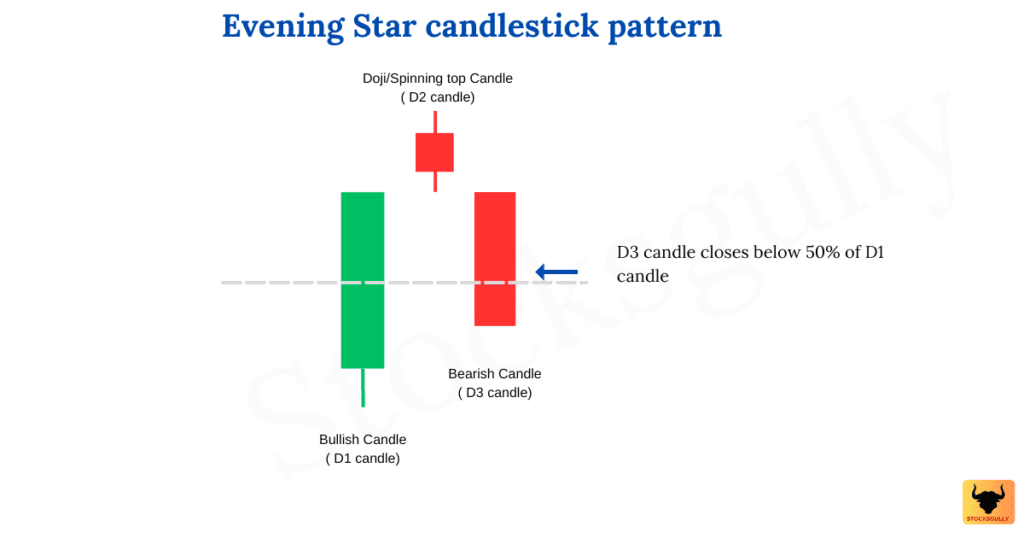
- If D3 candle close below 50% of the length of D1 candle , then its better.
How to spot a Good Probability Evening Star pattern on the candlestick chart
- First mark support and resistance zone on the candlestick chart
- Identify the current trend. It should be uptrend if you want to trade on this pattern
- Now find this “three candlestick pattern” where the first candle should be green , second candle should be doji or a small body candle ( Called as spinning top also ) and third candle should be long red candle. D3 (3rd candle) should close below the low of D2 (2nd candle)
- Check whether this candlestick formation is at the resistance zone. If there is a resistance zone then probability of the setup increases
- Volume: If D2 candlestick has low volume and D3 candlestick has high volume , then the probability of pattern increases.
- Stop Loss: Stop loss in Evening star pattern can be kept at slightly higher level from red candle high (D2 candle) which is small or a doji candle. Suppose if D3 candle is very large then you can put stop loss at D3 candle high also.
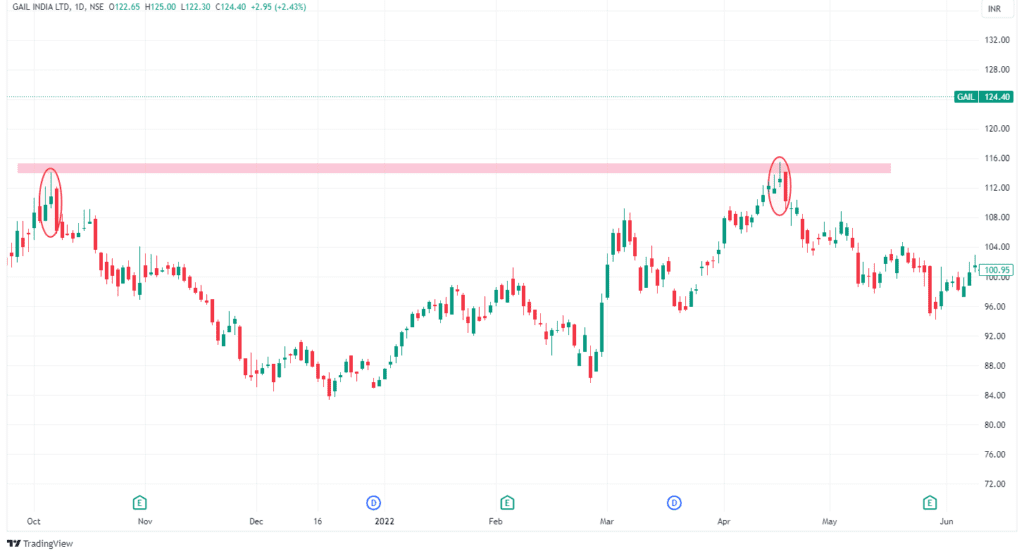
Example of Evening Star Pattern
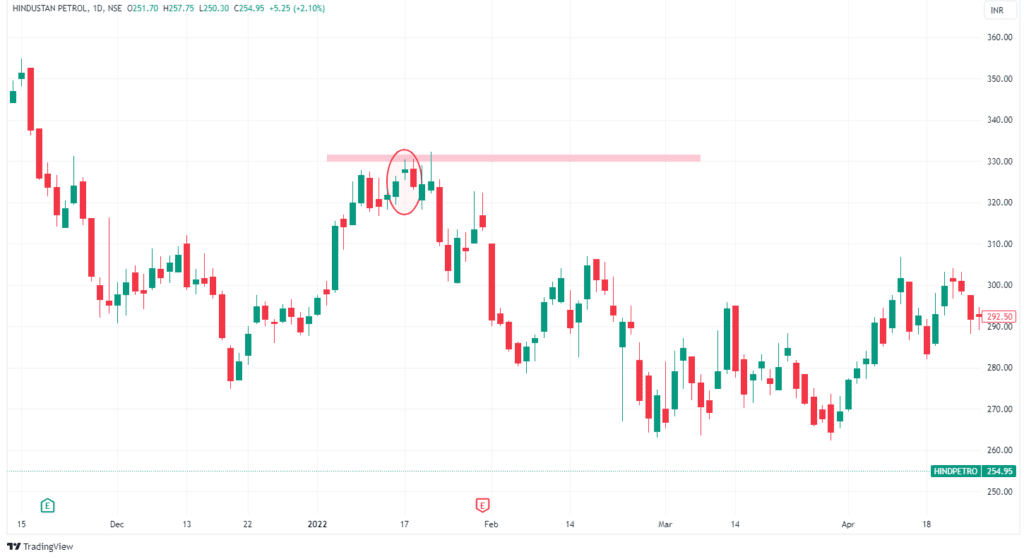
Example 1 : Hindustan Petrol on 1D time frame
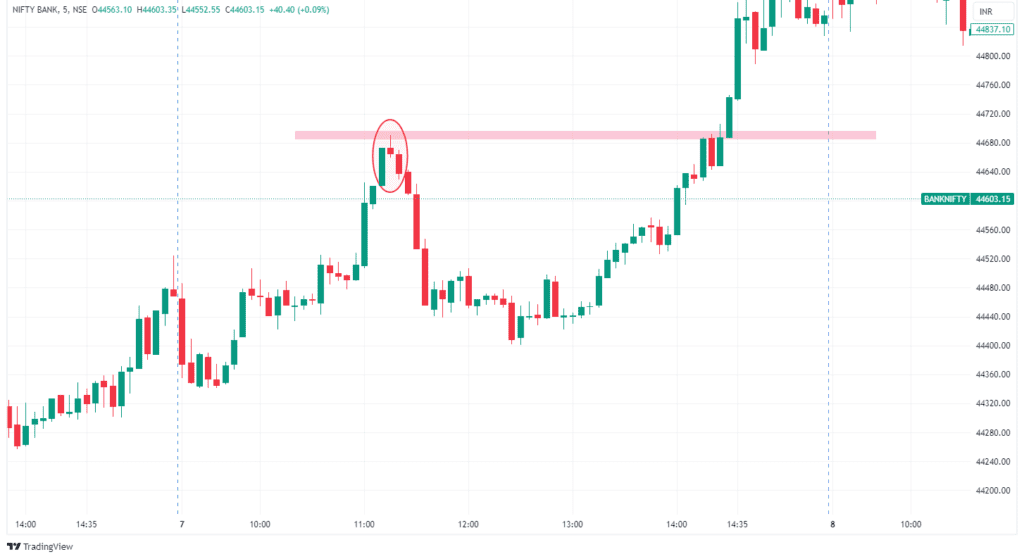
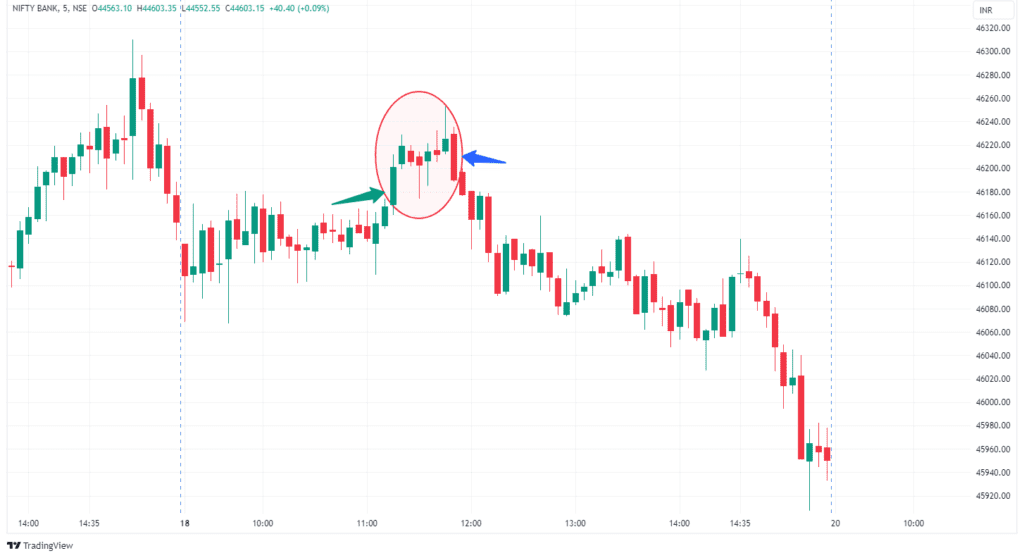
Example 2 : Bank NIFTY on intraday (5 min time frame)
How to Trade Evening Star Pattern?
Now we know that the Evening star pattern is powerful when it is formed in the uptrend and probability of reversal after this candlestick pattern is high but there are few scenarios that a trader should consider:
1.If the pattern formation is not perfect
Suppose you don’t get a perfect pattern ( How a perfect pattern forms is mentioned at the start of this article) , then should you trade or not?
You should focus more on what is happening on the chart and try to understand the price behavior’s. Like we have mentioned before in this article ( Under section psychology of traders when this pattern is formed) , first there should be a halt in the prices and then bears should take control . This can happen if there are more than 1 spinning tops candle or if there is no gap up when spinning top candle is formed etc. These are all variations in this pattern but the psychology is the same and hence reversal can happen . The variations are more common and occur frequently in the market then perfect evening star pattern , so a trader should practice and understand the variations to trade on this pattern.
2.The location is not supporting reversal
In trading we should look for a high probability or “A category trades” where most of the things are in our favour. Suppose you are taking a trade with this patten which is not at a particular resistance zone then it might be possible that reversal will fail. So, it is not a high probability trade in this case and you can wait for another entry.
3.What is price action telling us after we have entered the trade
Once you have entered the trade , is it making lower highs and lower lows ( Which means downtrend has started ) ? Monitoring the market after trade will help you getting confidence in price action trading. This doesnt mean that you should panic after entering the trade, but monitoring will give you confidence.
StocksGully Tip:
Does Evening star pattern work if stock is in strong uptrend?
If the upward trend is very strong and prices has come to a resistance zone, do not take trade immediately after this pattern is formed. In most of the cases, there is no V shape reversal. If this candlestick pattern is formed, it will give a hint that sellers might be activated at this level. Once prices stays there for few more candles and move downward, then it can be a good probability trade.
Key Takeaways and Points To Remember
- The evening star candlestick pattern is a three-candlestick pattern where 1st candle show bullishness with a green candle , 2nd candle show inactiveness with doji or spinning top and 3rd candle shows that bears are active in market with a large body red candle closing below low of second candle.
- It is a reversal pattern which is more powerful when the current trend is upward
- As the stop loss is 2nd candle high, it gives a good risk reward ratio . If the length of 3rd red candle is large , stop loss can be kept at 3rd candle high too.
- Always calculate the risk reward before taking a trade.
- If the location of the candle is also favourable then it becomes a high probable trade
FAQ’s
What is Evening Star candlestick?
Evening Star candlestick is a three-candle reversal pattern . Once it is formed in an uptrend , then prices will either halt or reverse from the location. High of the pattern act as a resistance for future price action.
Is an Evening Star bullish or bearish ?
Evening Star is a bearish candlestick pattern. After this pattern is formed, there is a high probability of trend reversal as market sentiment has changed. It is indicated by bearish red candle (D3 candle)
What is the target in Evening Star pattern?
Candlestick pattern indicates trader psychology and also help in understanding price movement in future but it doesnt tell target that a trader should take . Technical analysis should be used for setting up the target but still a trader can set target at risk reward of 1 or 2. Stop loss is the high of D2 candle.
Any opinions, news, research, analyses, prices, or other information contained on this website is provided as general market commentary for educational purpose only and does not constitute investment advice. StocksGully will not accept liability for any loss or damage including, without limitation, to any loss of profit which may arise directly or indirectly from use of or reliance on such information.