
In this “Swing Trading strategy: No 1”, we will discuss Weekly Supertrend Strategy. This we can apply when we expect prices to go up.
Concept
- Supertrend is a lagging indicator which means it follows price movement and gives confirmation of an ongoing trend to a trader.
- Weekly timeframe is used so that noise in the prices can be removed and you will get lesser but good entries. As you analyze charts in higher timeframe, false signals in prices and patterns are less. Daily and weekly timeframe are good for swing or positional trading in stocks.
Weekly Super trend strategy
Capital Allocation
A trader should allocate 5-6% of overall capital in one stock. This means, if you have 10 lac rupees to allocate then around 50,000 Rs will be allocated in 1 stock and you will have around 20 stocks in the portfolio. Maximum allocation can move to around 8-10% in a single stock if you have great conviction in the price structure.
Indicator used: Supertrend
Setting for Indicator : 10,3. These are also default settings and it will look like this on trading view.
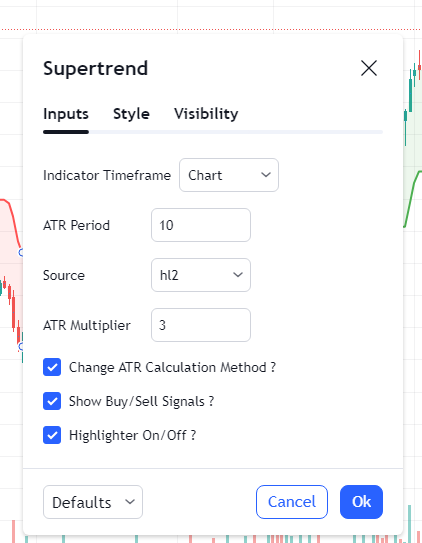
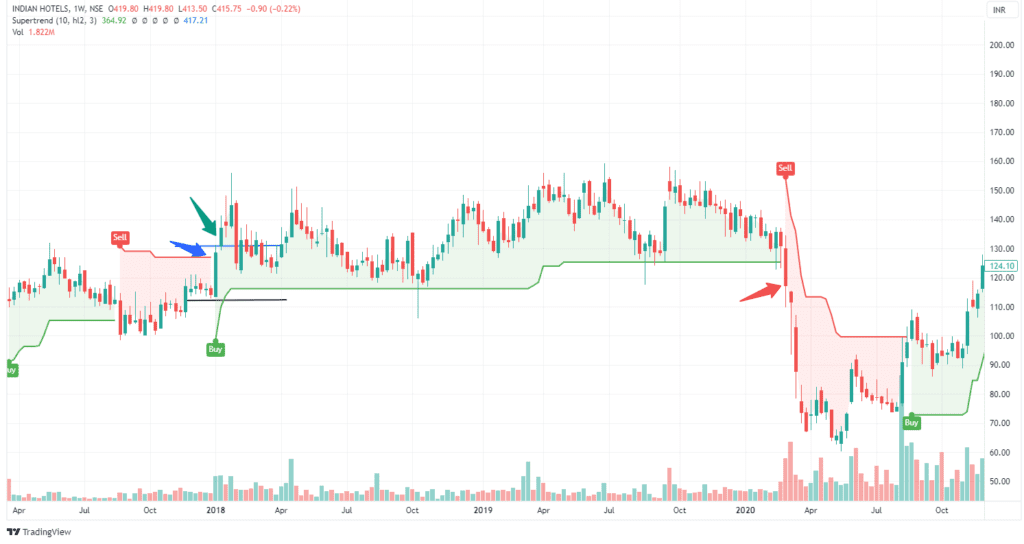
The indicator turns green when it signals an entry and turns red when it signals an exit. We will see the same on charts in the example.
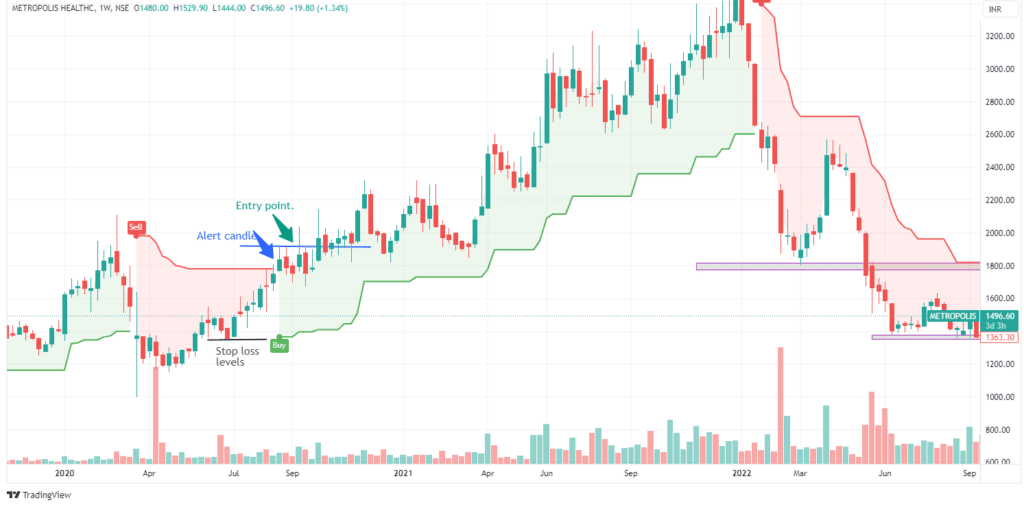
Entry Rule
Step 1: First we must identify the “signal/alert candle” on the candlestick charts. It is the candle which closes above supertrend indicator as per this strategy. We will not take trade at this candle, but it is an indication that probability of prices moving up is higher. We will enter the trade once the next weekly candle moves above the high of the signal candle.
Stop Loss
It should be swing low (If prices close below swing low) or if super trend indicator turns red.
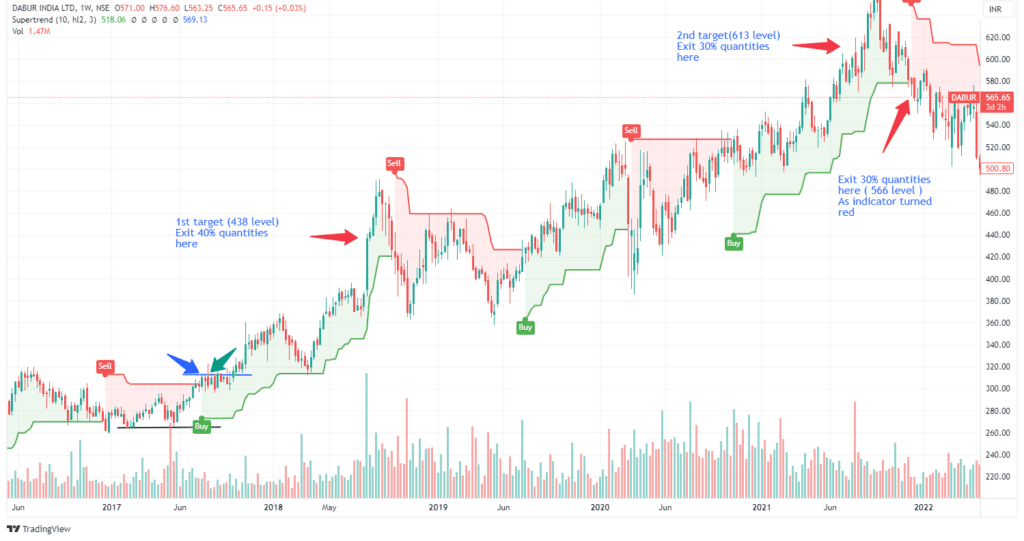
Exit Rule
As it is a swing trading strategy, so we will not exit all our position at once but will exit in different stages. This will help us to ride the trend and get maximum ROI. Now let us see how you will exit the position once prices are moving in your direction:
- Stage 1: We will exit 40% of the position, once prices increased by 40% from the buying price.
- Stage 2: We will exit 30% of the position, once we get 40% more appreciation in prices as calculated from Stage 1. (If you have not understood this step, then do not worry. It will get clear when it is illustrated with help of an example.)
- Stage 3: Remaining 30% will be exited once prices break previous swing low or super trend turns negative.
Example:
Suppose you took 1000 quantities of a stock at 100 Rs/Share. So total investment = 1,00,000 Rs (1 lac rupees)
Now let us evaluate the ROI using our exit rule step by step:
Stage 1: We will exit 40% of 1000 quantities means 400 quantities at 140 Rs (Once stock prices reach 140, then it means prices have increased by 40% over 100 which is our buy prices.).
How much money we made in Step 1: 400*140 = 56000 Rs
Quantity left = 1000-400 = 600
Stage 2: We will exit next 30% of 1000 means 300 quantities at 196 Rs. Now let us see how 196 Rs is calculated here:
We have exited quantities in Step 1 at 140 Rs. If we calculate 40% increase in prices from 140, then it will be 196 Rs. So in step 2 you need to calculate 40% appreciation not from buy price but from the exit price in Step 1. I hope this is clear now
How much money was made in Step 2: 196*300 = 58800
Quantity left = 300
Stage 3: We will exit remaining 300 quantities once prices break previous swing low or supertrend turns negative. Let us assume prices reversed from 196 Rs (Exit price at Step 2) and broken swing low at 150 Rs where you will exit the remaining 300 quantities.
How much money we will make in Step 3: 300*150 = 45000 Rs
Total money that we made = 56000 + 58800+45000 = 1,59,800. So, our return is around 60% on an investment of 1 lac rupees.
Note: Now we know that by this strategy we can get around 60% return. So, make sure you do not risk more than 20-30% in one stock (If you are investing 100 in one stock, then stop loss cannot be more than 30. This will help you to maintain risk reward of more than 2)
Important points to consider basis this setup
- We will focus majorly on price and supertrend indicator in this strategy.
- We can also check volume. If the supertrend turns positive along with good volume in prices, then there is high probability that prices will move in your direction.
- Stop loss in this strategy is usually big but as we have seen in above example, if risk reward ratio is maintained , then you can get good returns.
Any opinions, news, research, analyses, prices, or other information contained on this website is provided as general market commentary for educational purpose only and does not constitute investment advice. StocksGully will not accept liability for any loss or damage including, without limitation, to any loss of profit which may arise directly or indirectly from use of or reliance on such information.