Technical traders use indicators to identify market trends and price movements. As a trader or investors, we always try to enter a trade when we predict that market will move in our direction. While some traders only analyze price along with support and resistance, others will depend on indicators to enter and exit the trade. These indicators can be categorized into two parts – LAGGING and LEADING INDICATORS.
Lagging indicators in stock market: These indicators do not predict but will tell us information based on past data only. They confirm a current trend which is already there in the market.
Leading indicators in stock market: These indicators are predictive in nature and they will signal how the prices are likely to move in future.
Let us understand this with a real-life example which is different from the stock market but it will give you clarity on this concept. We will see it basis stock market also later in this article . We will also discuss on how you can use lagging / leading indicators in trading.
Example:
Suppose you are analyzing the AUTO SALES in India. Now there are 2 ways you can analyze the data to predict the sales in current year (2023)
First Way
Past 3 years data of auto sales: Let us assume you get last 3 years data as mentioned below:
2020: 100 cars sold
2021: 120 cars sold
2022: 180 cars sold
Current year (2023 till Aug): Car sales are 130 cars sold
Now based on past data only you can say that in 2023 car sales will cross 180 because it is showing growth year on year. This is how lagging indicators work. It assumes only the data points of the past and predict.
Lagging indicators examples in the stock market: SMA (Simple moving average), EMA (Exponential moving average), MACD etc. We will discuss all these indicators and how to trade on these indicators in different articles.
Second Way
Suppose along with past year data of car sales, you also have some other data points . This data point can be that after Sep 2023, car sales will not happen because there will be problems in supply of auto parts. Will your perspective of car sales in 2023 change now?
Definitely yes !
It doesn’t matter whether there will be a problem in supply or not when September month comes , but that’s what you assume now and basis that you have predicted whether car sales will cross 180 or not . This type of analysis is a leading indicator which not only predicts car sales based on past data but also some other data points.
Leading indicators example in the stock market : Pivot points , RSI etc. We will discuss all these indicators and how to trade basis these indicators in different articles.
You need to understand both the categories of indicators as it will help you in trading stock markets better
Lagging and Leading Indicators. What is the Difference?
Lagging indicator
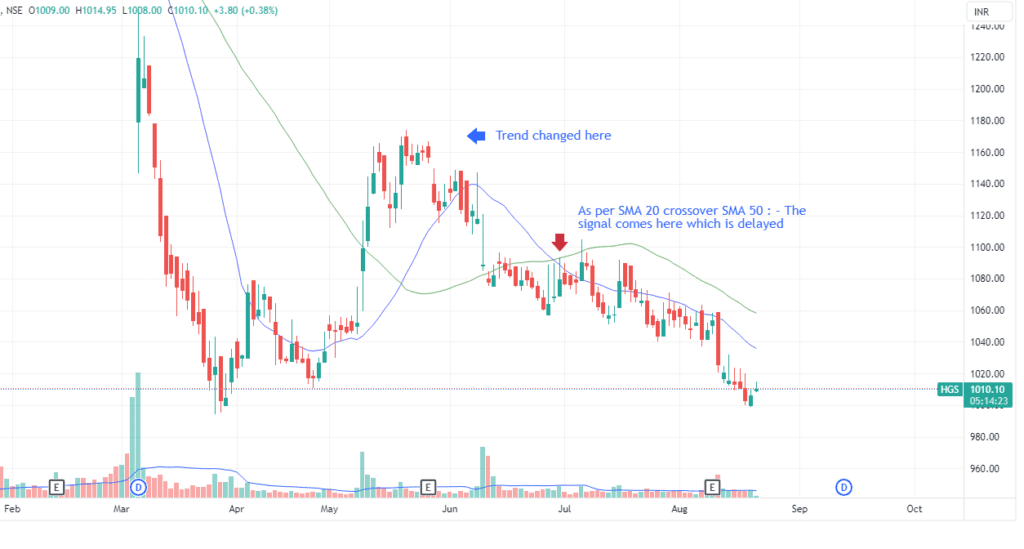
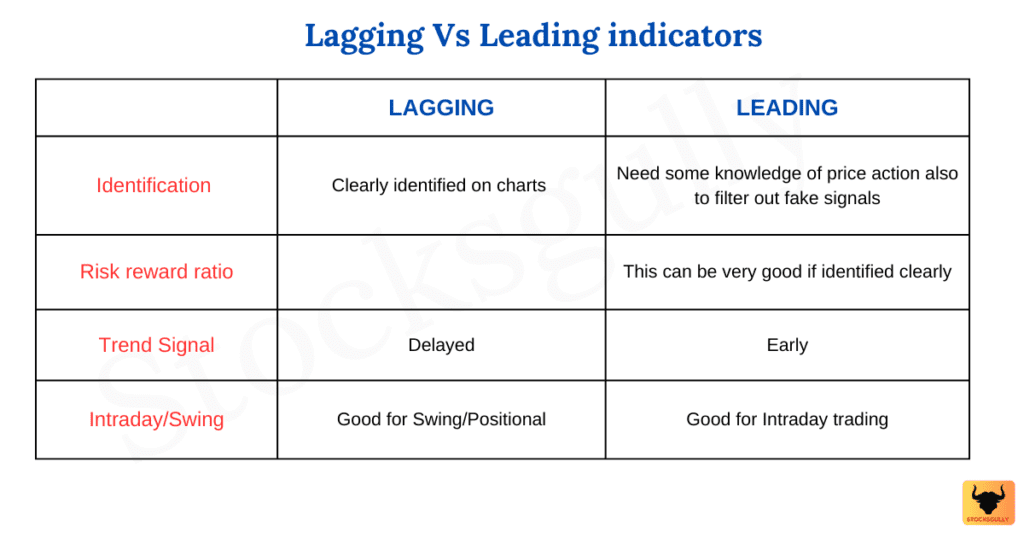
- Easier to identify but when it signals a particular trend , it might be too late . This happens because they are trend following indicators and usually give confirmation of the trend to a trader rather than predicting it.
- Lagging indicators might also give false signals in sideways market because it will change basis past data.
- Lagging indicators are more useful in swing or positional trading as a trader holds the trade for a larger duration.
- As signal given by lagging indicator is delayed, you might not be able to capture big moves (Especially in case of intraday trading)
- It might have more accuracy but could be late because it follows past prices.
Leading indicator
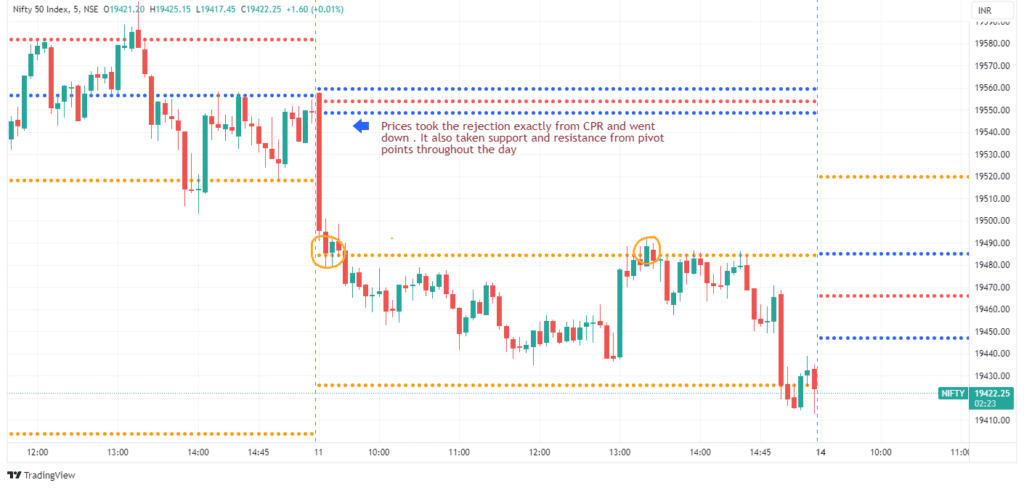
- It gives the signal earlier than lagging indicator but it depends on the experience of the trader to identify whether it is a false signal or not. This requires understanding of price action along with leading indicators.
- If you can correctly identify the signal given by leading indicators then it can give a very good risk reward ratio.
- These indicators are very helpful in intraday trading as the exit and entry is very fast or when you use it in a shorter time frame.
- While there are chances of false signal but it will help trader to enter trade very early as it gives the signal when trend is about to start . This also helps in lesser risk and higher reward if identified clearly
Lagging Vs Leading indicator chart
So which indicator is best for trading
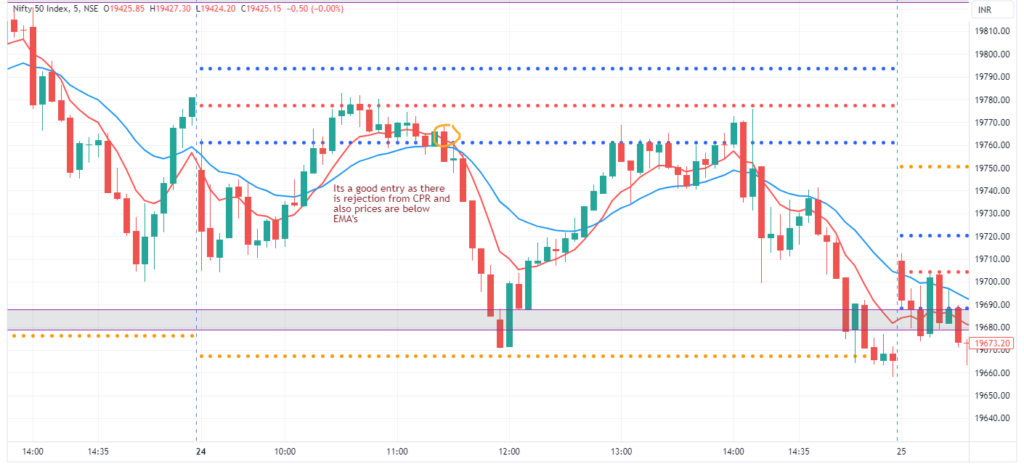
A trading strategy can be developed using both indicators and it depends on several factors like whether you are doing swing/positional trading or intraday trading, what is your risk reward ratio and risk per trade you can take etc.
Making trading strategy in the market by balancing both kinds of indicators is how investors and traders generally operate. So, you should not make a choice to go with only one kind of indicator. An experienced trader might not use any indicator and take trades based on pure price action. But does that mean you should not use it?
I think one should get experience in the market first to make that choice!
Lets see an example
Which indicator you should use as a beginner
It is better to use lagging indicators (Like SMA, EMA etc.) in a higher timeframe because signals are more accurate. As we use it for swing or positional trading, there is no hurry to enter and exit the trade. This will help in getting confidence in trades as you read and analyze more charts.
Once you start getting confidence in lagging indicators, you can also start learning leading indicators and back testing the same.
Key Takeaways
- Leading indicators are designed in order to anticipate further price movements to give the trader an edge in trading. It gives a great risk reward ratio.
- Lagging indicators are indicators which follow a trend then predicting price reversals. It follows prices in the past.
- One should not rely only on one of these indicator types but trading strategy should be developed using both lagging and leading indicators.
- As a beginner it is better to trade with lagging indicators in a higher time frame (Better not to start directly with options trading!)
Frequently Asked Questions
- What is the difference between leading and lagging indicators
Lagging indicators in stock market: These indicators do not predict but will tell us information based on past data only. They confirm a current trend which is already there in the market.
Leading indicators in stock market: These indicators are predictive in nature and they will signal how the prices are likely to move in future.
Recommended reading
- How to start trading in stock markets
- How to read candlestick for beginners
- How to choose best time frame for trading

Good content and knowledge!!